Families
Document History
Original Publish Date: 21 July, 2020
Updated on: 11 September, 2020
In this post we further analyse the families. We categorised them into two - declining and rising. We track down all the families started in 1970s till 2007. Then we assess their performance in the elections held after 2007. This includes 3 General elections and 2 Assembly elections. If they have one at least one election in these 5 elections we call them rising dynasties and rest of them as declining dynasties.
The follwoing table shows the difference the longevity of these two groups
| Success | Life span |
|---|---|
| Declining | 22 |
| Rising | 35 |
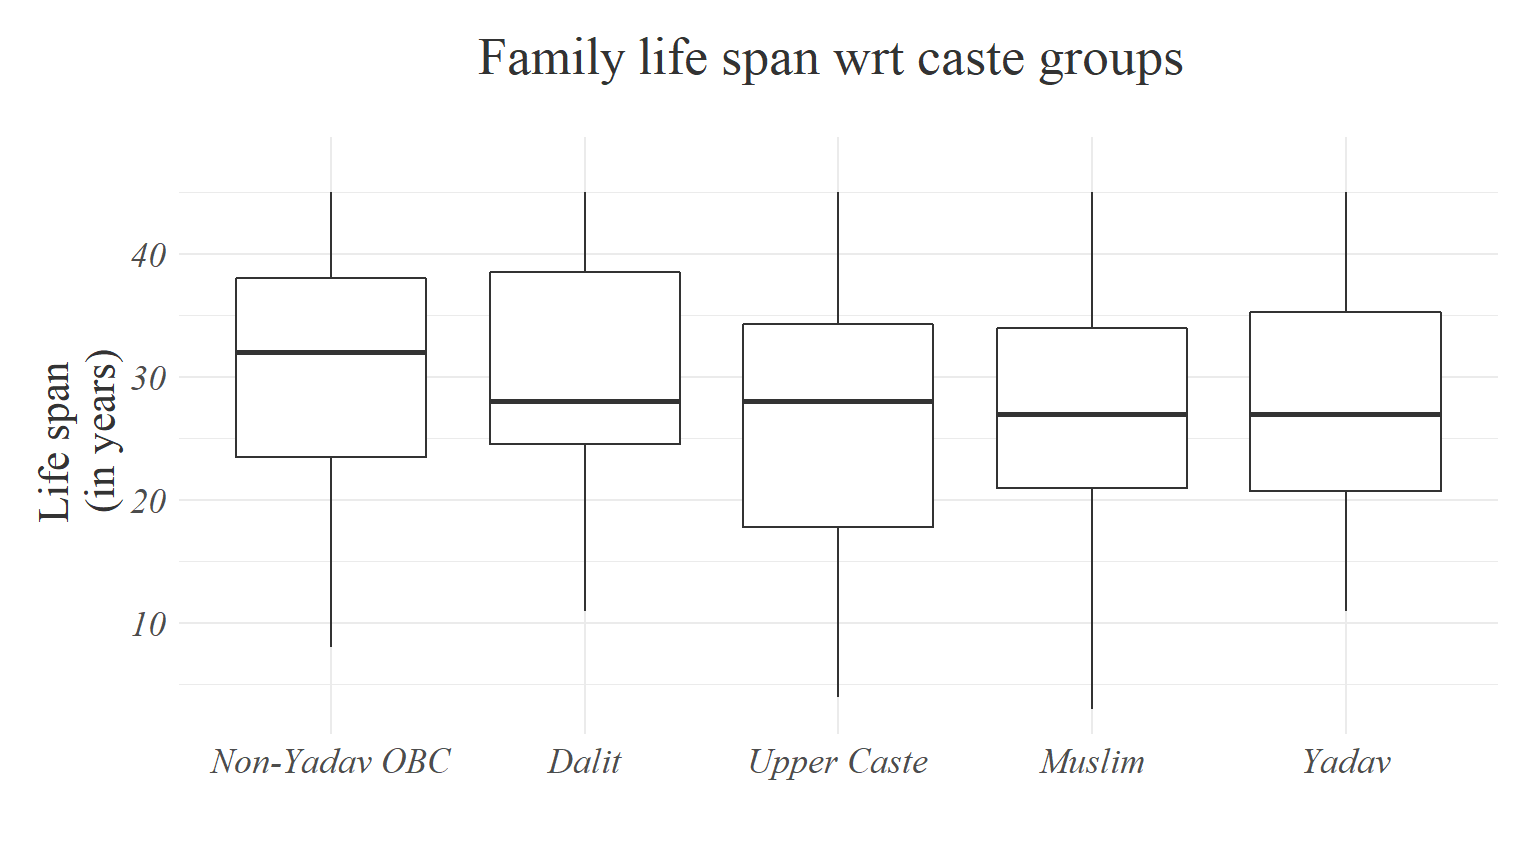
This chart depicts how the life span of a family varies according to their caste.
Summary of the two categories -
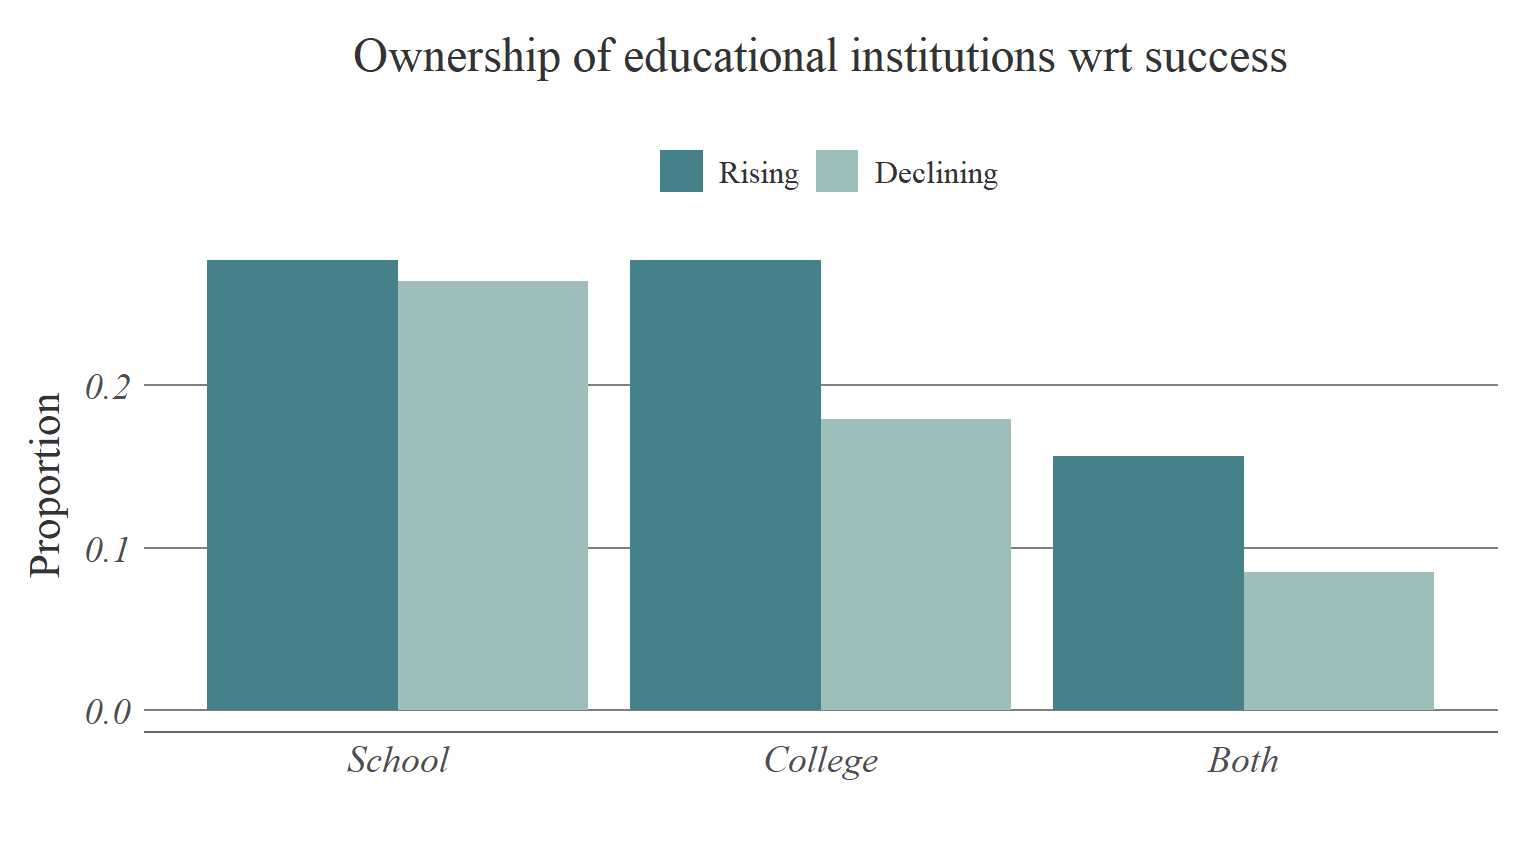
| Success | land | industires | N_minister | Minister duration (months) | school | college |
|---|---|---|---|---|---|---|
| Declining | 316.33 | 1.57 | 0.49 | 12.51 | 0.35 | 0.26 |
| Rising | 400.00 | 2.08 | 0.73 | 27.54 | 0.43 | 0.43 |
Here we regress the successful category against a multitude of variables. Given that it is binary dependent variable we are using a probit model here.
| Dependent variable: | |
| Rising | |
| caste_uc | 4.908 |
| (225.503) | |
| caste_yadav | 5.252 |
| (225.503) | |
| caste_non_yadav_obc | 5.140 |
| (225.503) | |
| caste_dalit | 5.072 |
| (225.503) | |
| caste_muslim | 4.938 |
| (225.503) | |
| minister_duration | 0.082** |
| (0.035) | |
| industry | 0.384*** |
| (0.134) | |
| school_college | 0.216 |
| (0.215) | |
| land | 0.0002 |
| (0.0003) | |
| linkage_down | 0.813** |
| (0.366) | |
| Constant | -6.222 |
| (225.503) | |
| Observations | 189 |
| Log Likelihood | -110.679 |
| Akaike Inf. Crit. | 243.359 |
| Note: | p<0.1; p<0.05; p<0.01 |
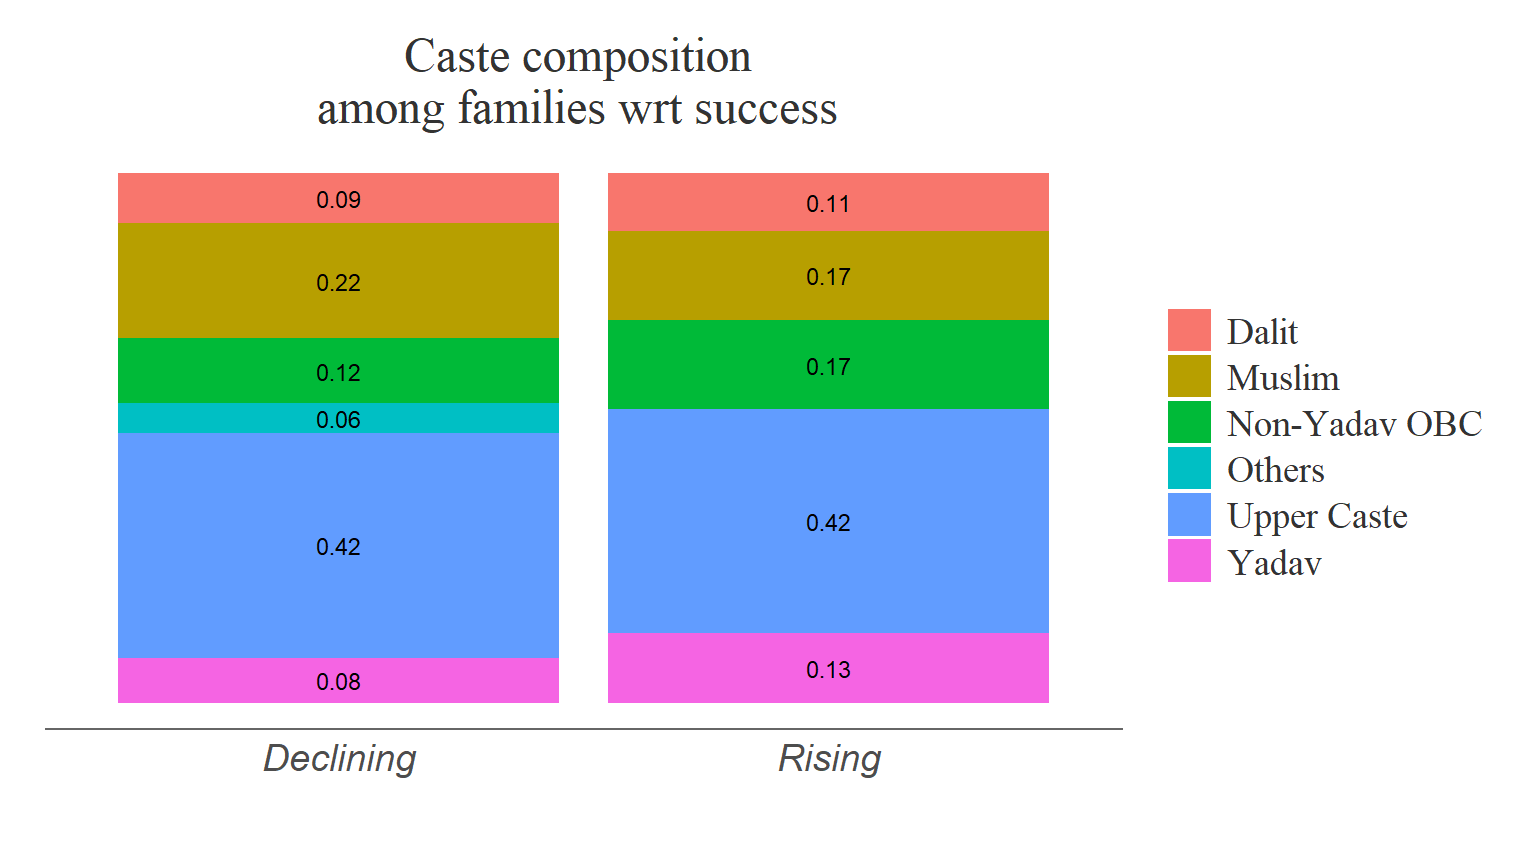
caste composition
Educational institutions