Linkage Analysis
Document History
Original Publish Date: 23 June, 2020
Updated on: 07 September, 2020
In politics few of the players become successful in building a dynasty. Among those successful ones some of them expands their territory to multiple levels. In this post, we look at those families to see what enabled them for their expansion. This analysis exclusively among families.
We use TRUE/FALSE to represent a families linkage.
ADR
In the first part, we are using ADR data which is available for the years 2012 and 2017 for AE and 2009,2014 and 2019 for GE.
Summary
This table shows us the number of families with linkage.
| Linkage | Count |
|---|---|
| FALSE | 179 |
| TRUE | 274 |
Assets
| Linkage | Total assets | Movable Assets | Immovable Assets |
|---|---|---|---|
| FALSE | 37408611 | 8625479 | 25184182 |
| TRUE | 49008457 | 11663793 | 31261156 |
Crime
This table shows us the proportion of families in each category with one or more serious crimes.
| Linkage | Proportion |
|---|---|
| FALSE | 0.18 |
| TRUE | 0.28 |
Industry
In this section we calculate number of industries they own. According to our survey design Maximum number of industries that a family can have is 3 .
| Politician’s identity | Average number of ownersip |
|---|---|
| FALSE | 1.5 |
| TRUE | 1.8 |
This table shows the break-up of the rent type among those industry owners
| Politician’s identity | rent-type | Proportion |
|---|---|---|
| FALSE | non-rent-thick | 0.47 |
| FALSE | rent-thick | 0.53 |
| TRUE | non-rent-thick | 0.31 |
| TRUE | rent-thick | 0.69 |
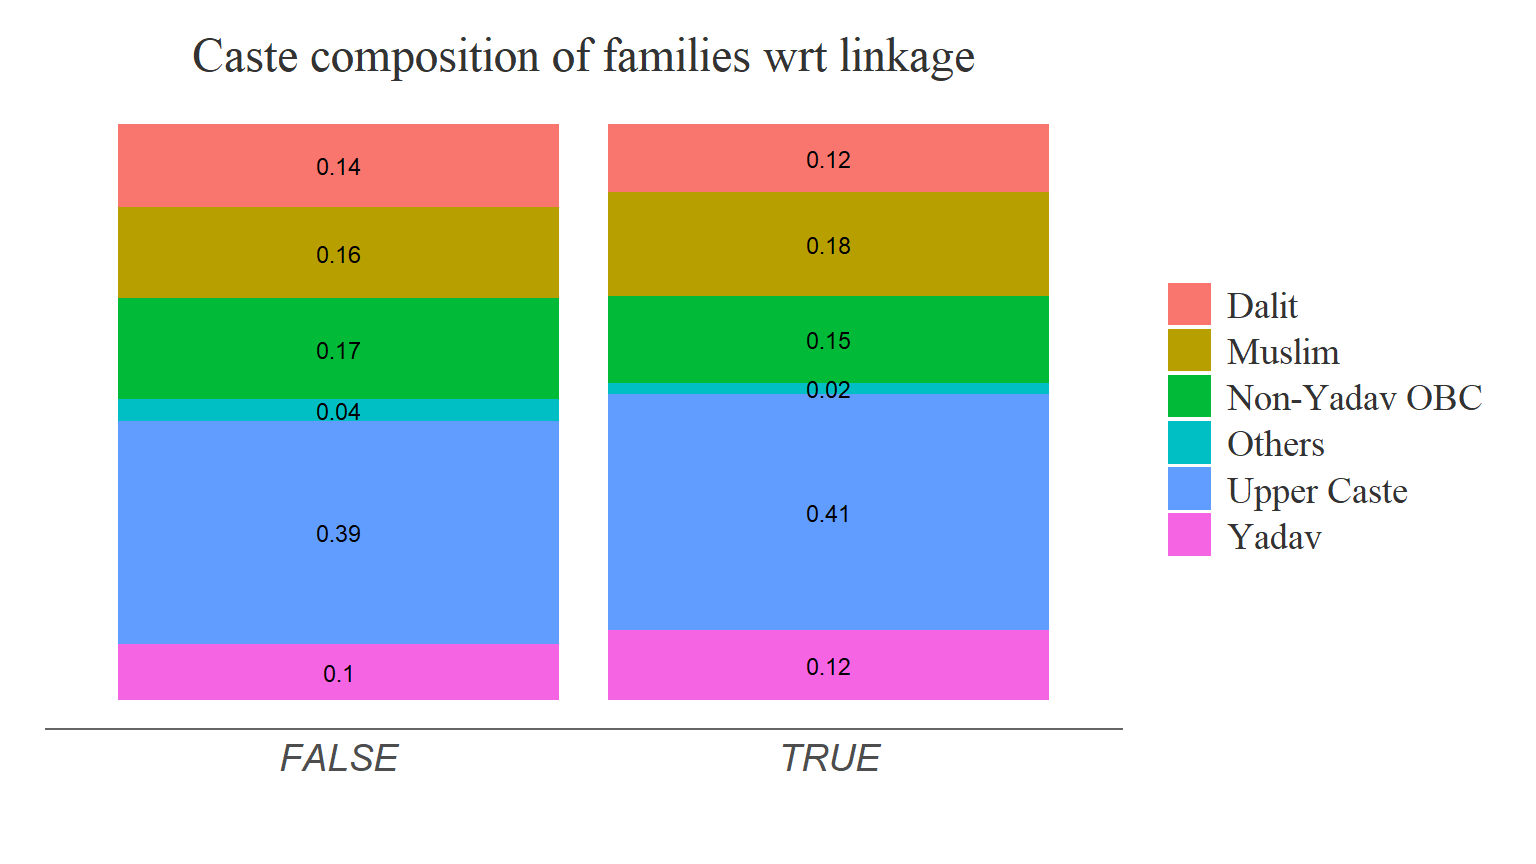
Caste
This sections shows the composition of caste with regards linkage.
MPLADS
MPLADS data is available for the year 2004 & 2009. The following table summarises the families with and without linkage.
| Linkage | Count |
|---|---|
| FALSE | 14 |
| TRUE | 35 |
| Type of constiuency | Average number of contracts | Avergae expenditure per project |
|---|---|---|
| FALSE | 223 | 314624 |
| TRUE | 481 | 317570 |
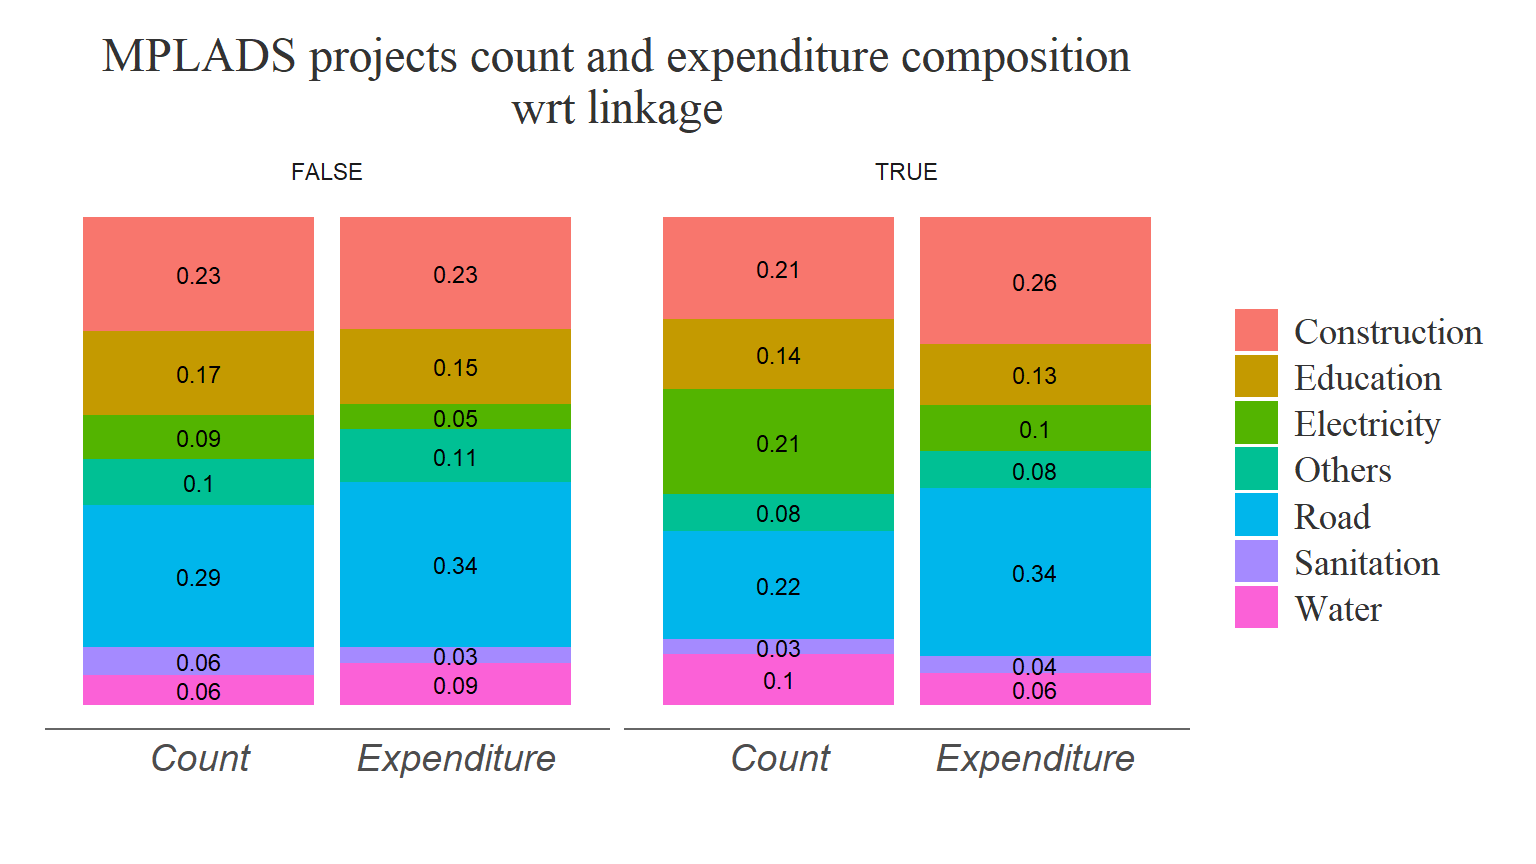
Project count and expenditure
This section looks at the categorical distribution of type of MPLADS projects and spending among families with regards to their linkage.
The following stacked chart depicts the composition of both number of projects and the expenditure with regards to linkage.
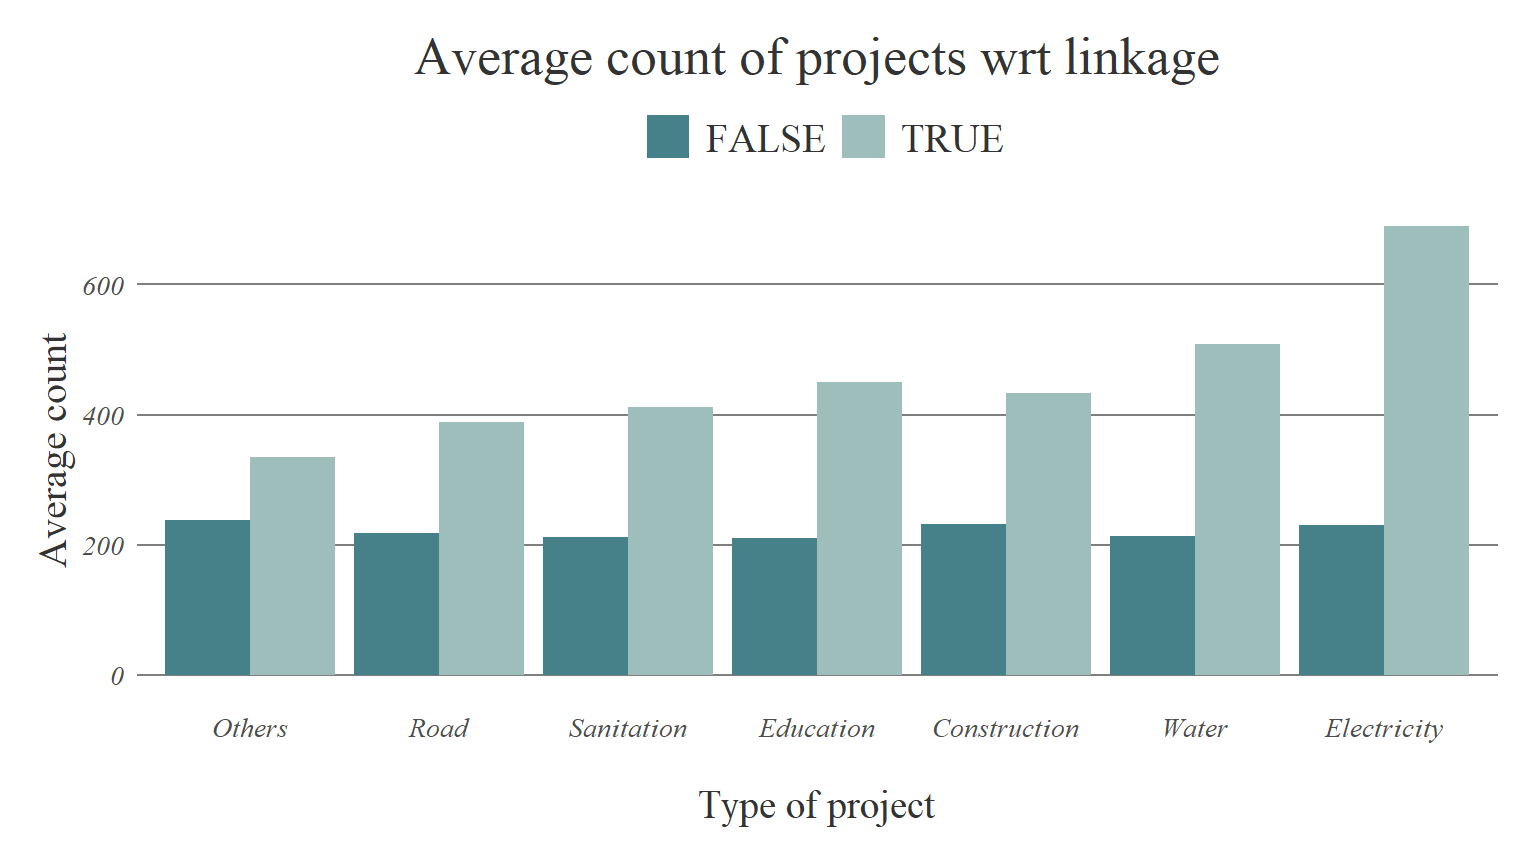
This bar chart depicts the average number of projects in each category withregards to linkage.
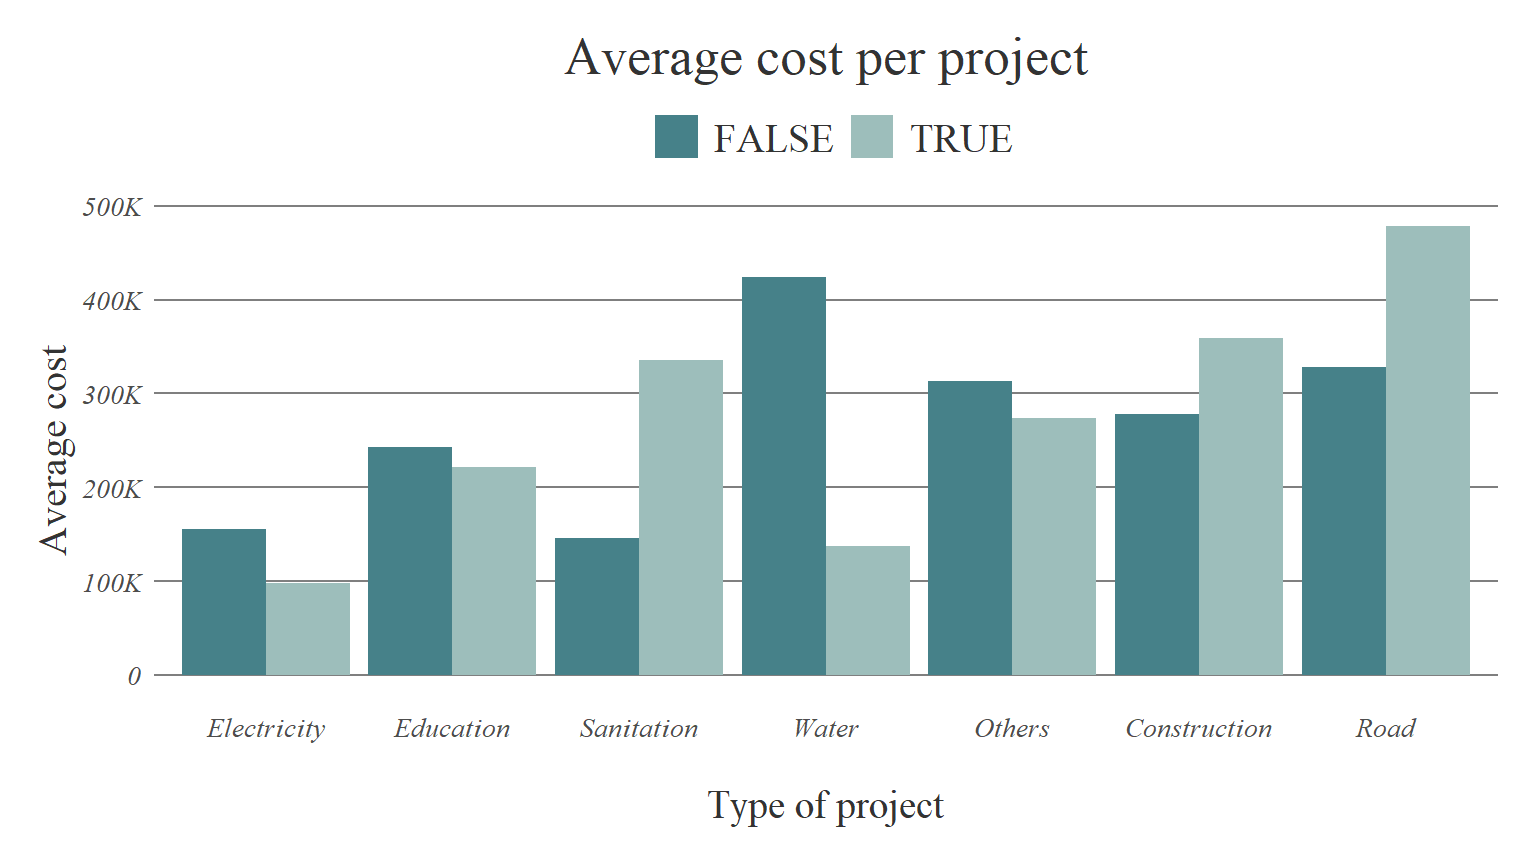
This bar chart depicts the average cost incurred for each category of projects withregards to family linkage.
cost categories
We categorised the project expenditure to three -
Categories:
Low - 0-.2 mn
Medium - 2.2 mn - 5 mn
High - 5 mn+
Here we are analysing how they differes withregards to families linkage status
| Linkage | Cost Categry | Proportion of projects |
|---|---|---|
| FALSE | Low | 0.48 |
| TRUE | Low | 0.51 |
| FALSE | Medium | 0.34 |
| TRUE | Medium | 0.27 |
| FALSE | High | 0.18 |
| TRUE | High | 0.22 |
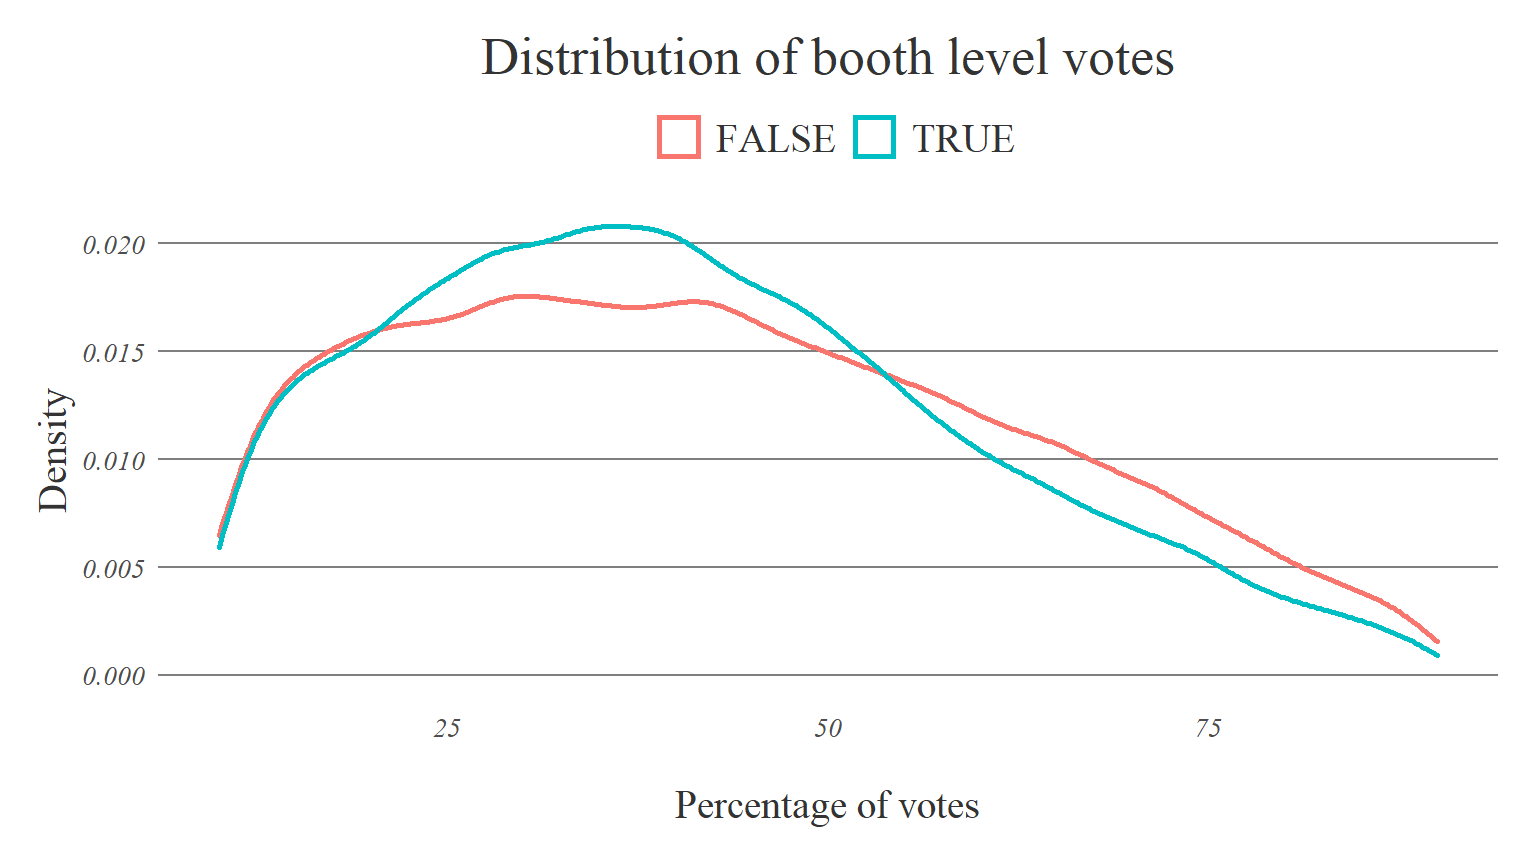
Raphael
Raphael’s booth level data is available for the last 3 UP assembly elections. We use the booth level voting data to see the spread of the vote share.
The following table summarises the families with linkages for last 3 assembly elections in UP.
| Linkage | Count |
|---|---|
| FALSE | 104 |
| TRUE | 170 |
Vote dispersion
| Politician’s Identity | Variance |
|---|---|
| FALSE | 367 |
| TRUE | 301 |
| Politician’s Identity | SD |
|---|---|
| FALSE | 18.7 |
| TRUE | 17.0 |