Master file Analysis
Document History
Original Publish Date: 10 June, 2020
Updated on: 07 September, 2020
In this project we are using a novel dataset compiled by Rahul Verma. This dataset covers the candidates contested in the different levels of elections held from 1974 to 2019 in the state of Uttar Pradesh. This includes assembly, general and local body elections. This dataset connects the contestants to the political offices to their family members within that universe.
We define dynast politicians as those who are preceded by family members who are currently active in politics or were active in the past. Family is defined as a set of individuals who are bound by proximate ties based on blood or marriage, and this definition includes father, mother, grand parents, siblings and in laws. Active in politics refers to holding an office in an elected body or being a candidate in elections. According to this definition, the head of family or the patriarch is considered to be a non-dynast in the year of entry. Precisely, because of the fact that he did not enjoy any advantage of having family members in politics at that point of time. But, ones a family member enter into the universe of politics, in later years patriarch will be considered as dynast along with the descendants.Additionally, both the first and second member should be entered to the system through assembly or general elections
Summary statistics
AE - GE
This universe includes winners and runner-ups in the general and assembly elections from the year 1977 to 2019.
- Total observations: 11550
- Number of unique individuals: 5286
- Number of unique families : 300
The following section provides the year and election level wise break-up of the observations
Assembly Elections
| Year | Count |
|---|---|
| 1974 | 804 |
| 1977 | 806 |
| 1980 | 806 |
| 1985 | 806 |
| 1989 | 806 |
| 1991 | 794 |
| 1993 | 800 |
| 1996 | 804 |
| 2002 | 806 |
| 2007 | 806 |
| 2012 | 806 |
| 2017 | 806 |
General Elections
| Year | Count |
|---|---|
| 1977 | 158 |
| 1980 | 158 |
| 1984 | 158 |
| 1989 | 158 |
| 1991 | 156 |
| 1996 | 158 |
| 1998 | 158 |
| 1999 | 158 |
| 2004 | 158 |
| 2009 | 160 |
| 2014 | 160 |
| 2019 | 160 |
Levels
Families are spread at multiple office levels. While majority them are present only at the assembly election level, there are a quite a few of them which is spanned across multiple level of office. The following table summarises that -
| level | count |
|---|---|
| AE | 154 |
| GE-AE | 94 |
| AE-LB | 19 |
| GE-AE-LB | 19 |
| GE | 14 |
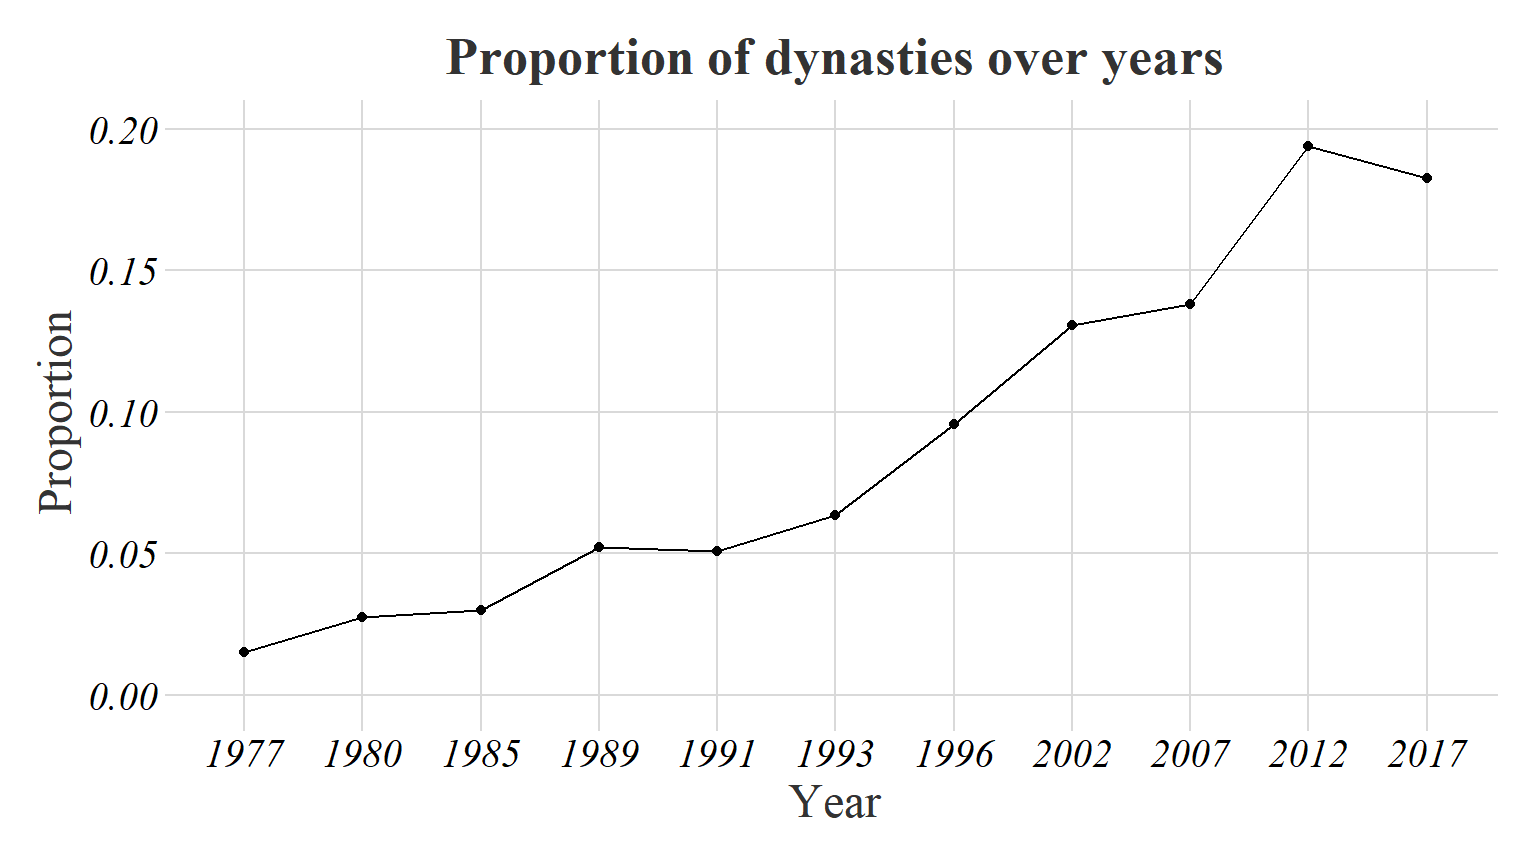
Dynast presence in the past elections
This chart depicts the proportion of dynast among the winners of assembly election since 1974.
AE GE election contest
There could four types of election contests:
- Dynast wins against against a Dynast
- Dynast wins against a Non-dynast
- Non-dynast wins against another Non-dynast
- Non-dynast wins against a dynast
First table shows count of the contests and the second one shows the proportion of contests. First part represents the winner in both the tables headers.
| year | fam v/s fam | fam v/s non-fam | non-fam v/s fam | non-fam v/s non-fam |
|---|---|---|---|---|
| 1977 | 1 | 9 | 7 | 465 |
| 1980 | NA | 15 | 8 | 459 |
| 1984 | 1 | 5 | 1 | 72 |
| 1985 | 1 | 11 | 13 | 378 |
| 1989 | 2 | 28 | 21 | 431 |
| 1991 | 1 | 29 | 23 | 422 |
| 1993 | 1 | 26 | 16 | 357 |
| 1996 | 6 | 49 | 26 | 400 |
| 1998 | 5 | 8 | 9 | 57 |
| 1999 | 6 | 15 | 5 | 53 |
| 2002 | 14 | 41 | 26 | 322 |
| 2004 | 6 | 19 | 7 | 47 |
| 2007 | 9 | 50 | 51 | 293 |
| 2009 | 6 | 25 | 10 | 39 |
| 2012 | 21 | 62 | 46 | 274 |
| 2014 | 4 | 17 | 21 | 38 |
| 2017 | 12 | 64 | 76 | 251 |
| 2019 | 3 | 23 | 16 | 38 |
| year | fam v/s fam | fam v/s non-fam | non-fam v/s fam | non-fam v/s non-fam |
|---|---|---|---|---|
| 1977 | 0.00 | 0.02 | 0.01 | 0.96 |
| 1980 | NA | 0.03 | 0.02 | 0.95 |
| 1984 | 0.01 | 0.06 | 0.01 | 0.91 |
| 1985 | 0.00 | 0.03 | 0.03 | 0.94 |
| 1989 | 0.00 | 0.06 | 0.04 | 0.89 |
| 1991 | 0.00 | 0.06 | 0.05 | 0.89 |
| 1993 | 0.00 | 0.06 | 0.04 | 0.89 |
| 1996 | 0.01 | 0.10 | 0.05 | 0.83 |
| 1998 | 0.06 | 0.10 | 0.11 | 0.72 |
| 1999 | 0.08 | 0.19 | 0.06 | 0.67 |
| 2002 | 0.03 | 0.10 | 0.06 | 0.80 |
| 2004 | 0.08 | 0.24 | 0.09 | 0.59 |
| 2007 | 0.02 | 0.12 | 0.13 | 0.73 |
| 2009 | 0.07 | 0.31 | 0.12 | 0.49 |
| 2012 | 0.05 | 0.15 | 0.11 | 0.68 |
| 2014 | 0.05 | 0.21 | 0.26 | 0.48 |
| 2017 | 0.03 | 0.16 | 0.19 | 0.62 |
| 2019 | 0.04 | 0.29 | 0.20 | 0.48 |
Elections won
This table shows the count of the unique individuals with regards to the number of elections they have won
| n_elections_won | n_individuals |
|---|---|
| 0 | 2089 |
| 1 | 1886 |
| 2 | 665 |
| 3 | 329 |
| 4 | 173 |
| 5 | 74 |
| 6 | 35 |
| 7 | 15 |
| 8 | 12 |
| 9 | 5 |
| 10 | 2 |
| 14 | 1 |
Density graph of the same:
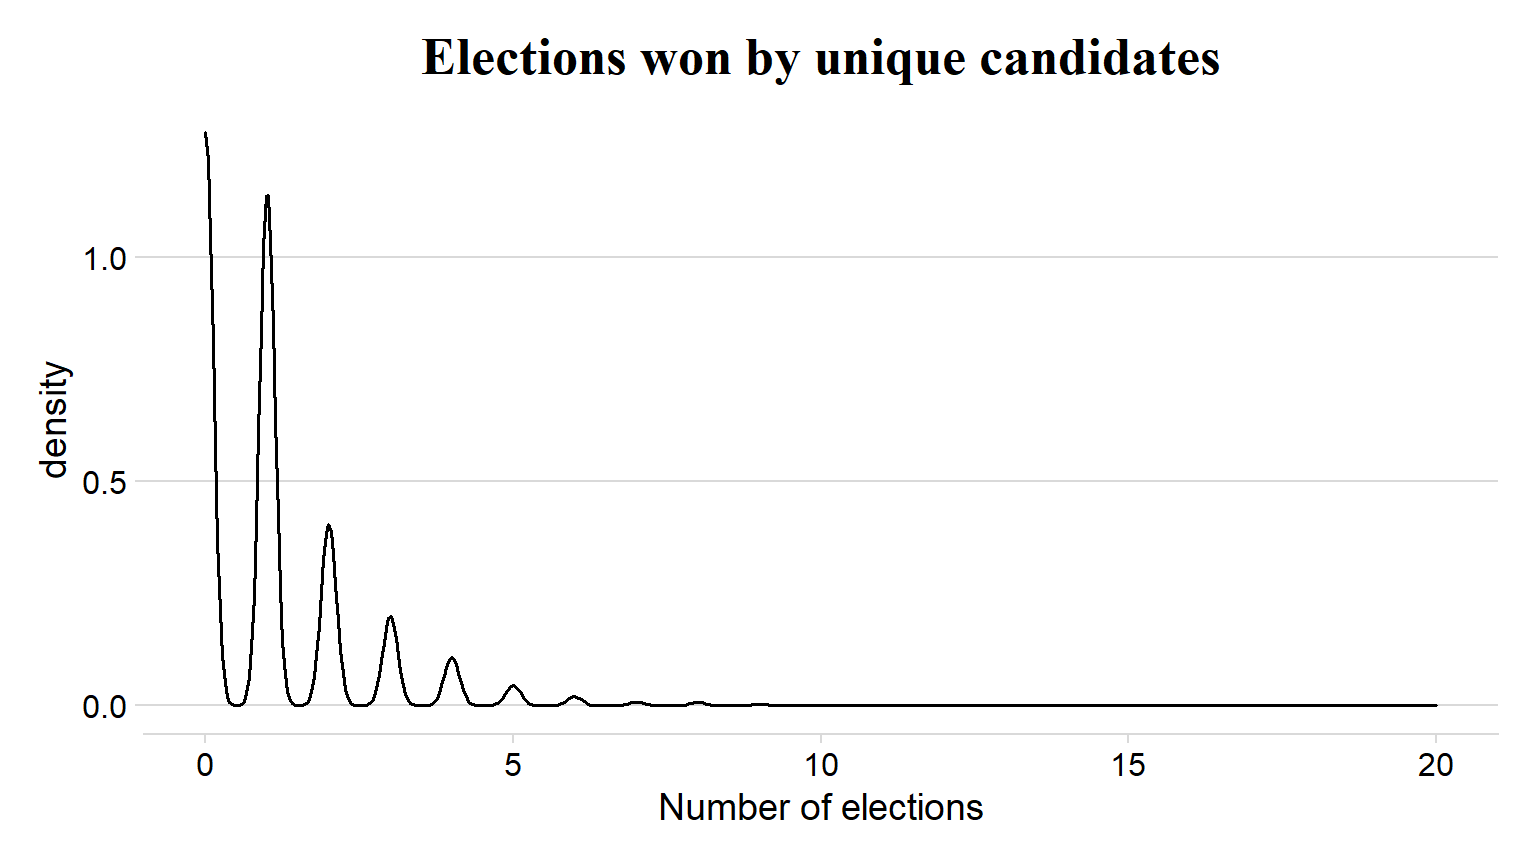
Density graph graph of the number of elections won by families
This density graph represents the same
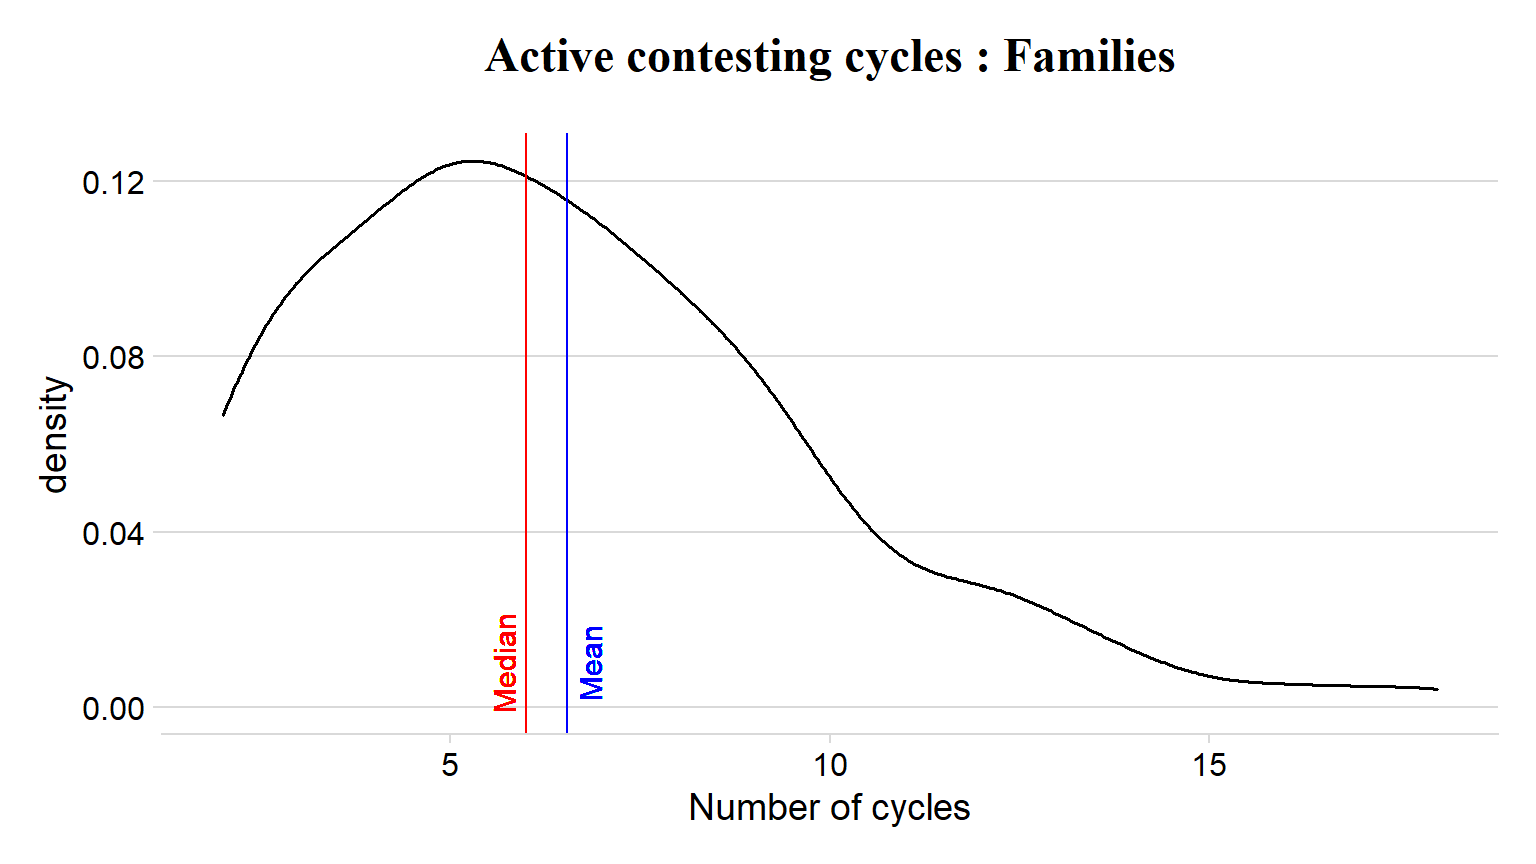
Elections contested
This table shows the count of the unique individuals with regards to the number of elections they have contested .
| n_elections_contested | n_individuals |
|---|---|
| 1 | 2764 |
| 2 | 1061 |
| 3 | 558 |
| 4 | 333 |
| 5 | 255 |
| 6 | 127 |
| 7 | 78 |
| 8 | 54 |
| 9 | 30 |
| 10 | 10 |
| 11 | 5 |
| 12 | 5 |
| 13 | 5 |
| 15 | 1 |
This is a density of graph of the number of elections contested by families
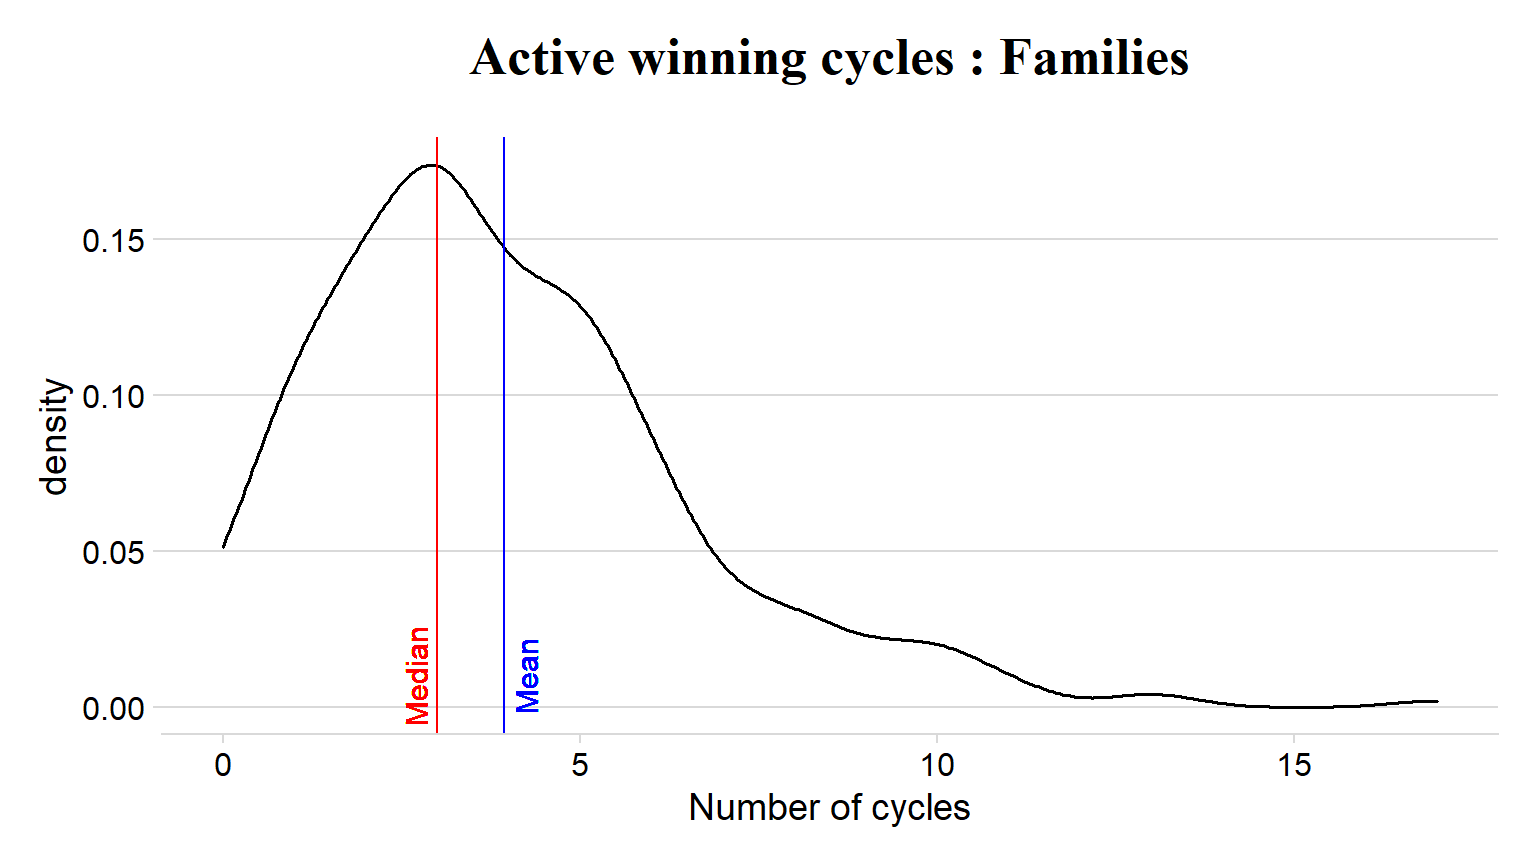
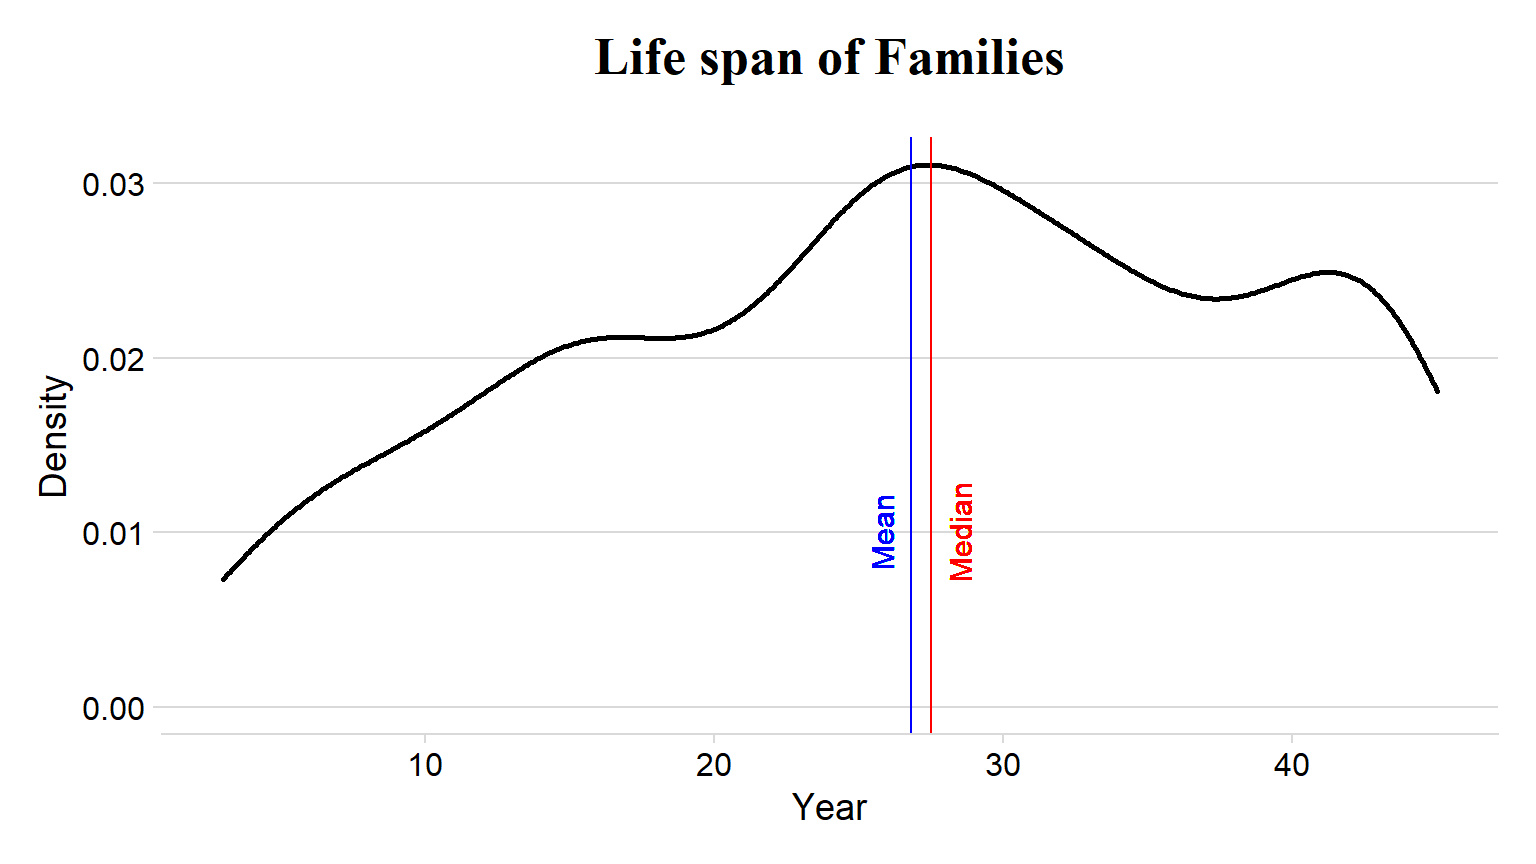
Life span
This section looks at the life span of families. Life span is calculated by computing the difference in entry year of the family with the. Life span is simply the longitudinal life of a family. This is calculated by simply computing the difference in the entry year of a family with the year in which the last member has contested. The following graph is a density chart of the the life span of the unique families in the dataset.
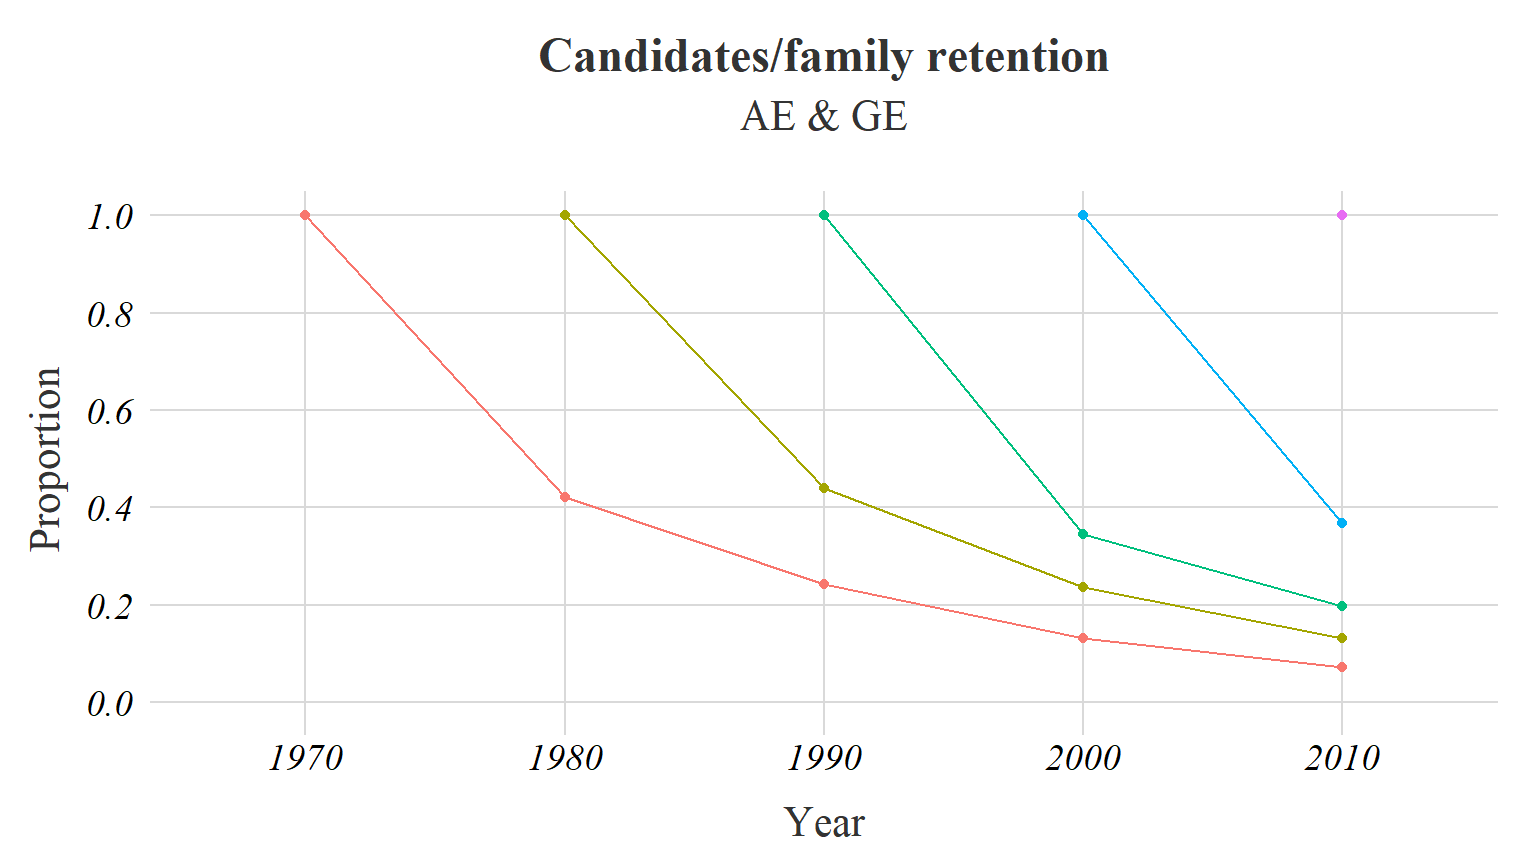
Retention
This chart depicts the retention of candidates after each election year.
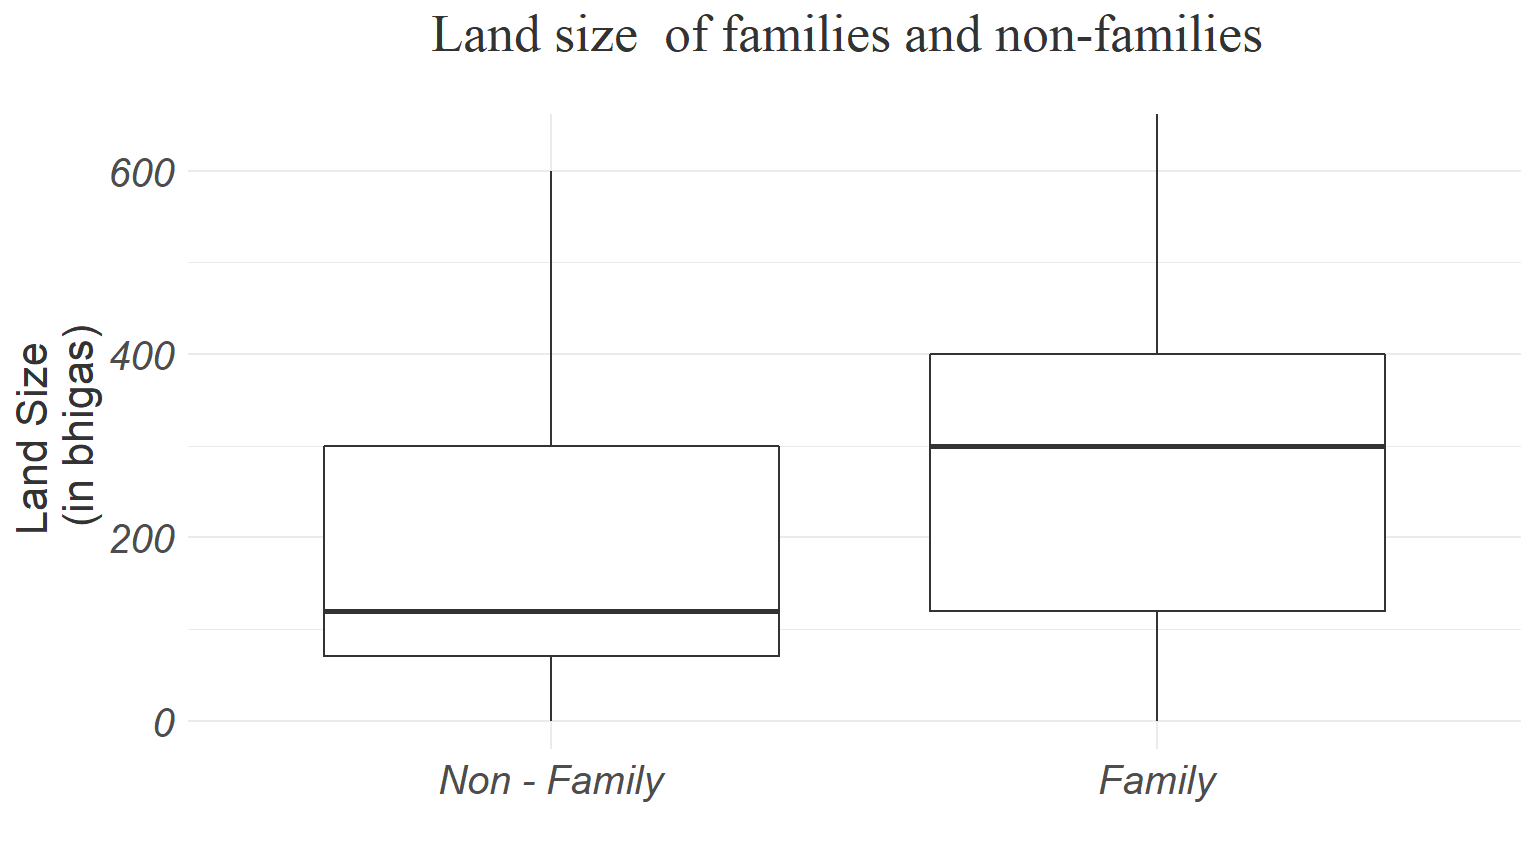
Land distribution
The dataset contains a variable named land which records the land owned by the candidate/family. The information is recorded in bhigas.
Families
This boxplot shows the difference the land owned by family and a non-family entity.
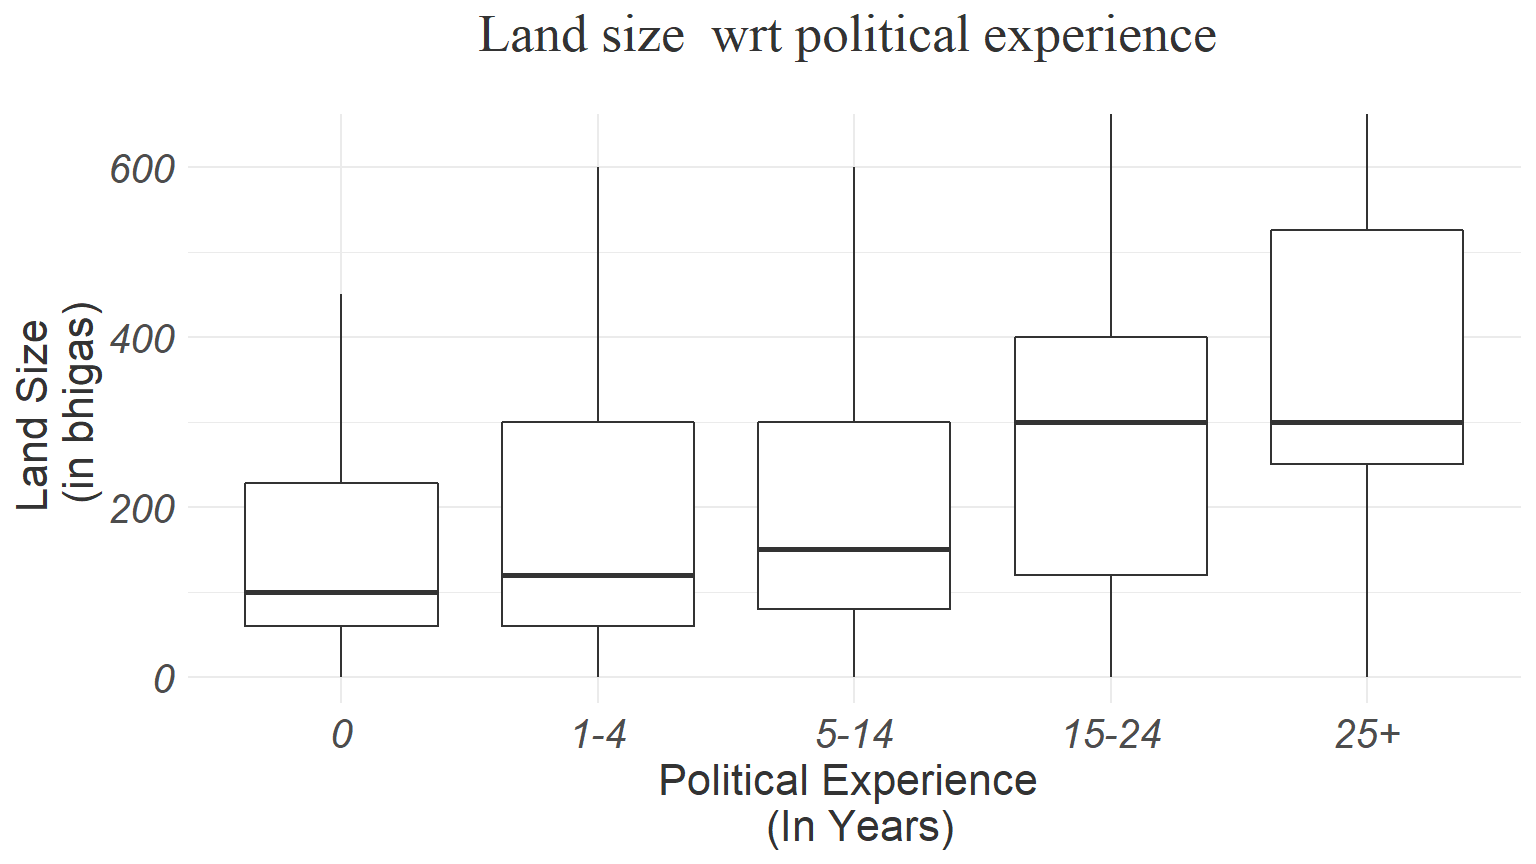
Political Experience
This boxplot shows the difference in the land ownership according to a candidate’s political experience. Political experience is the sum of term duration of every election that they have won.
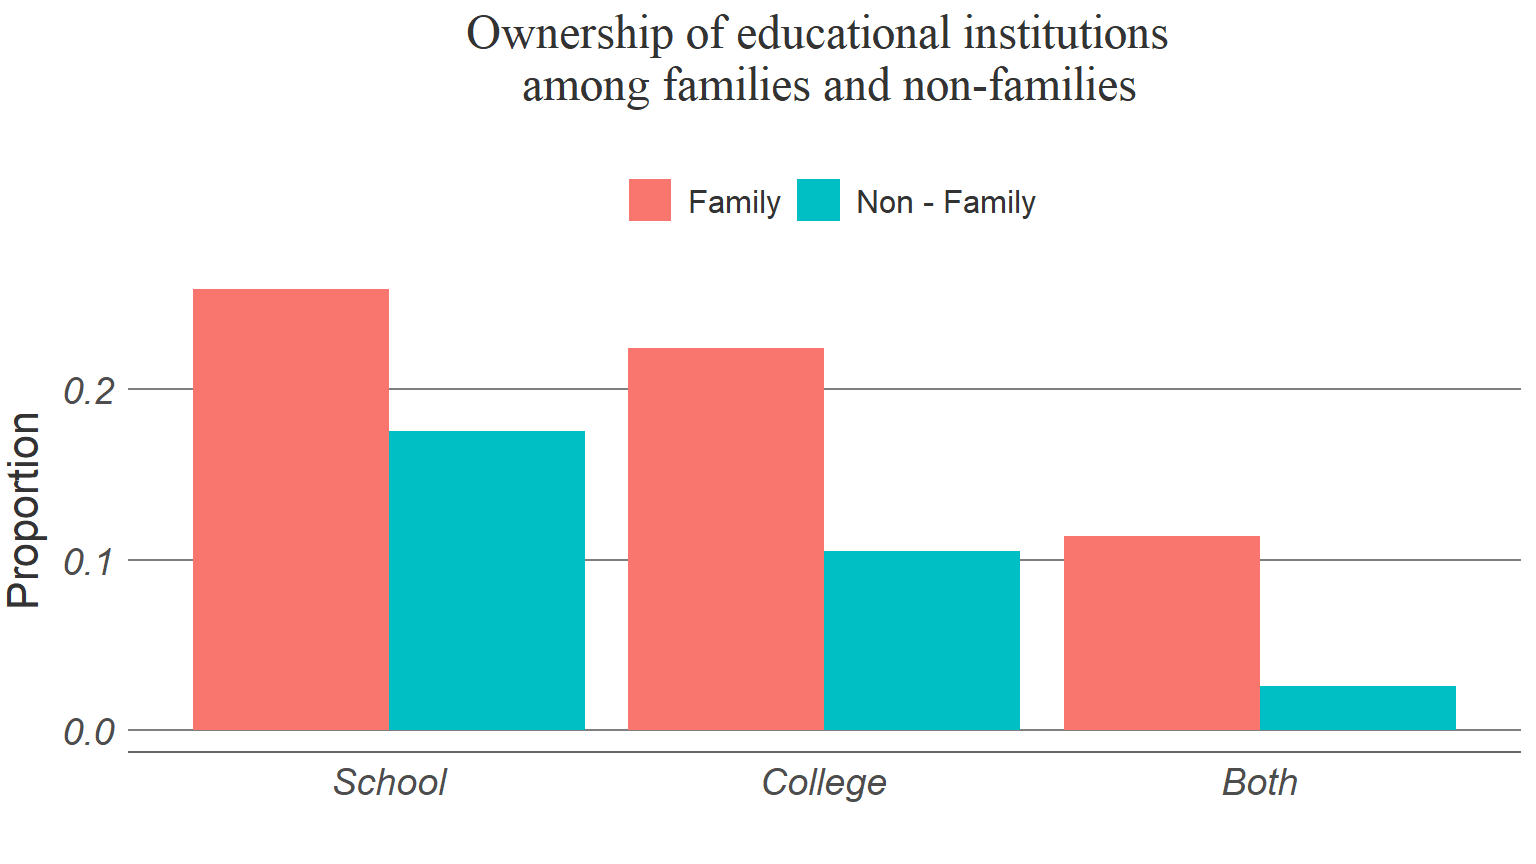
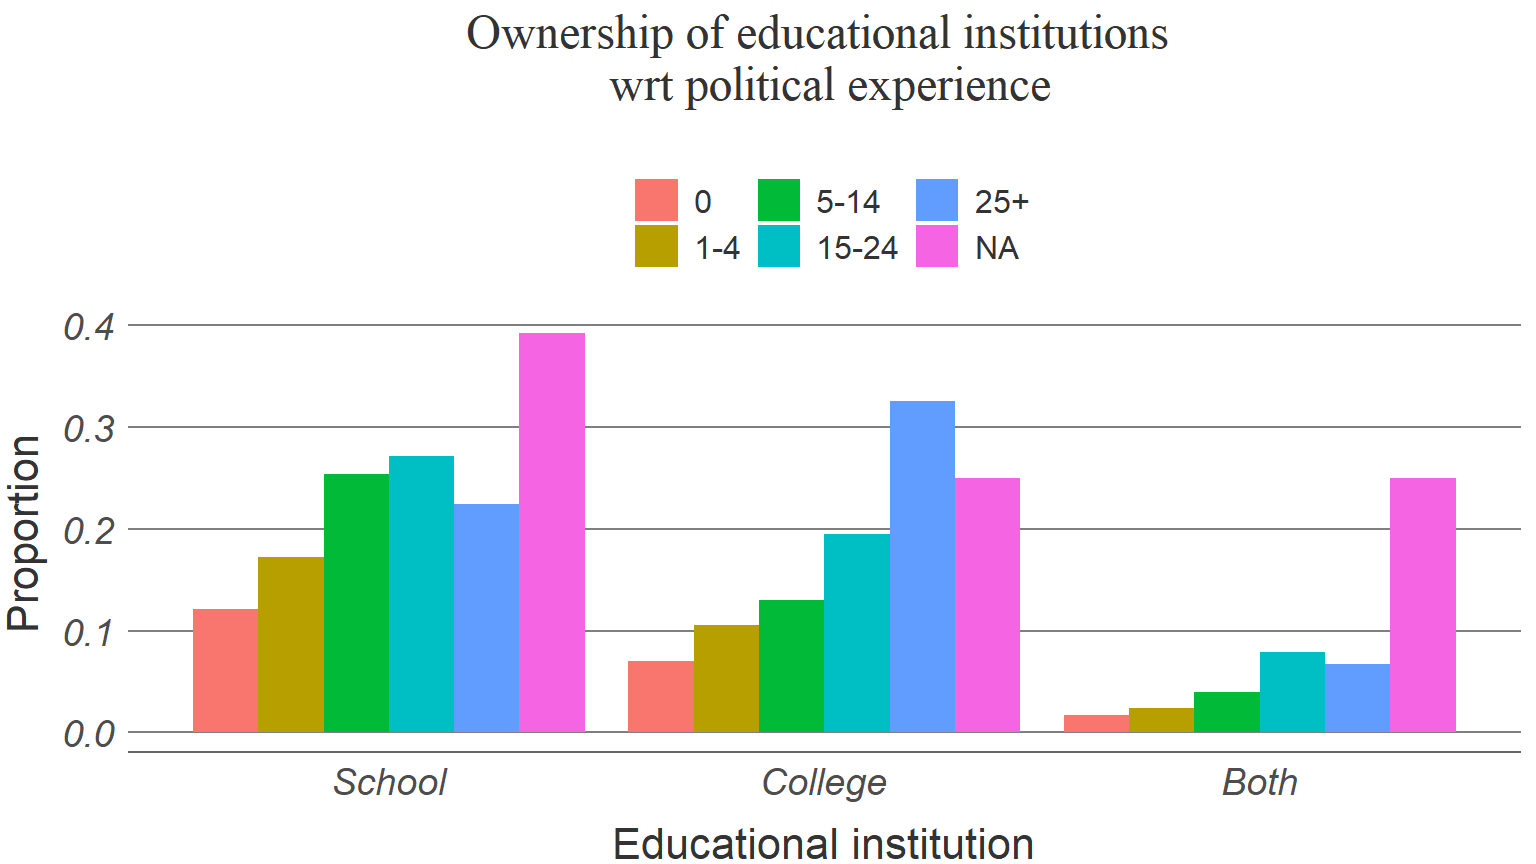
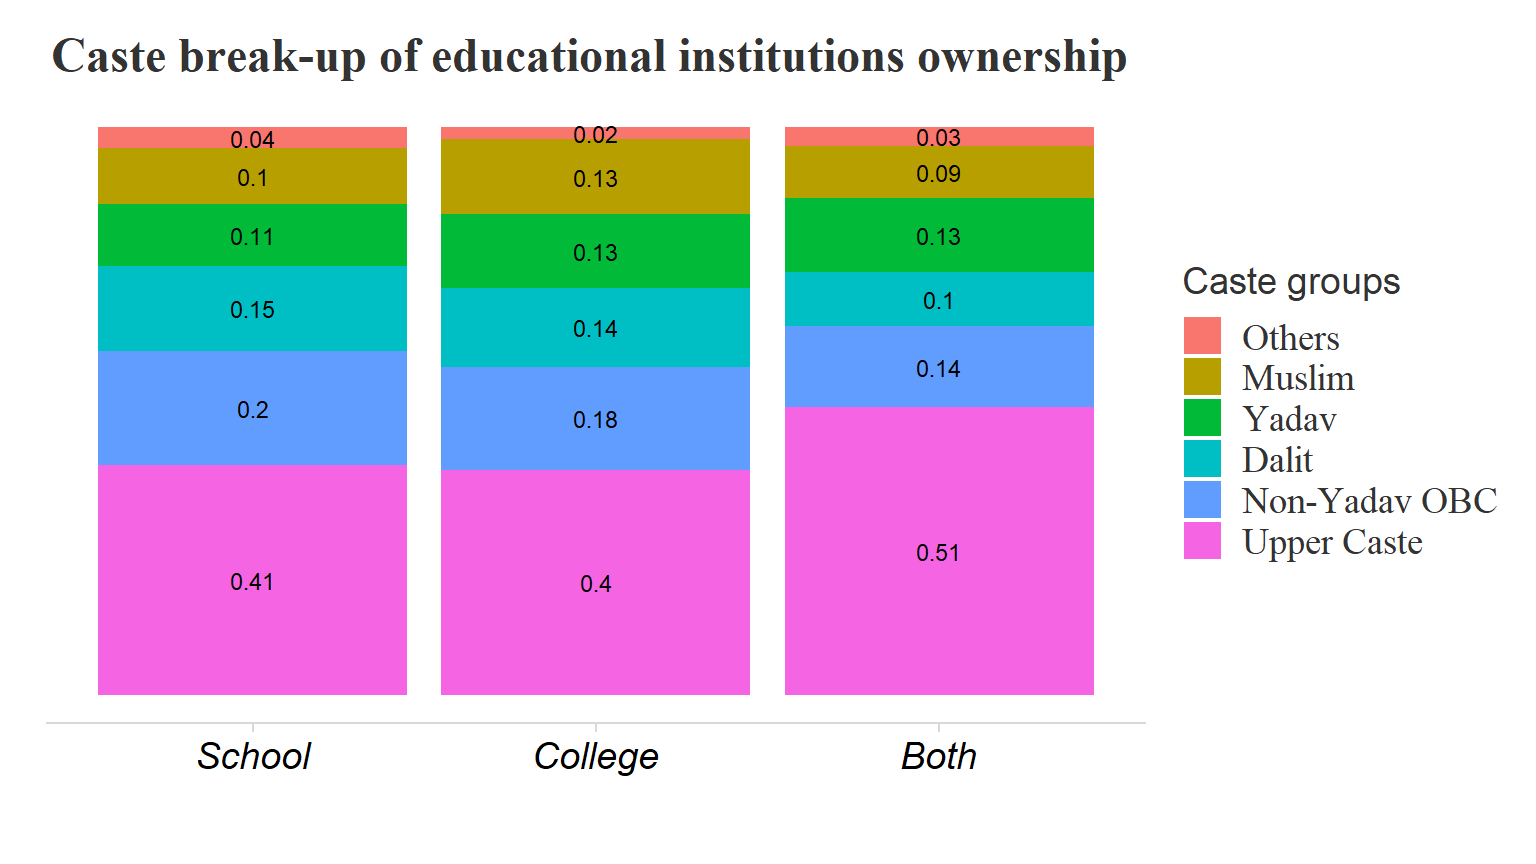
Educational institutions
The data set has variable which record the candidate’s/ family’s ownership of school/college/both.
Families
This barplot depicts the difference in the ownership of educational institutions among family and non-family entities.
Political Experience
This depicts the ownership of the educational institutions with regards to political experience of the unique individuals.
caste
Depicts the ownership of educational institutions with regards to the caste of the unique candidate.
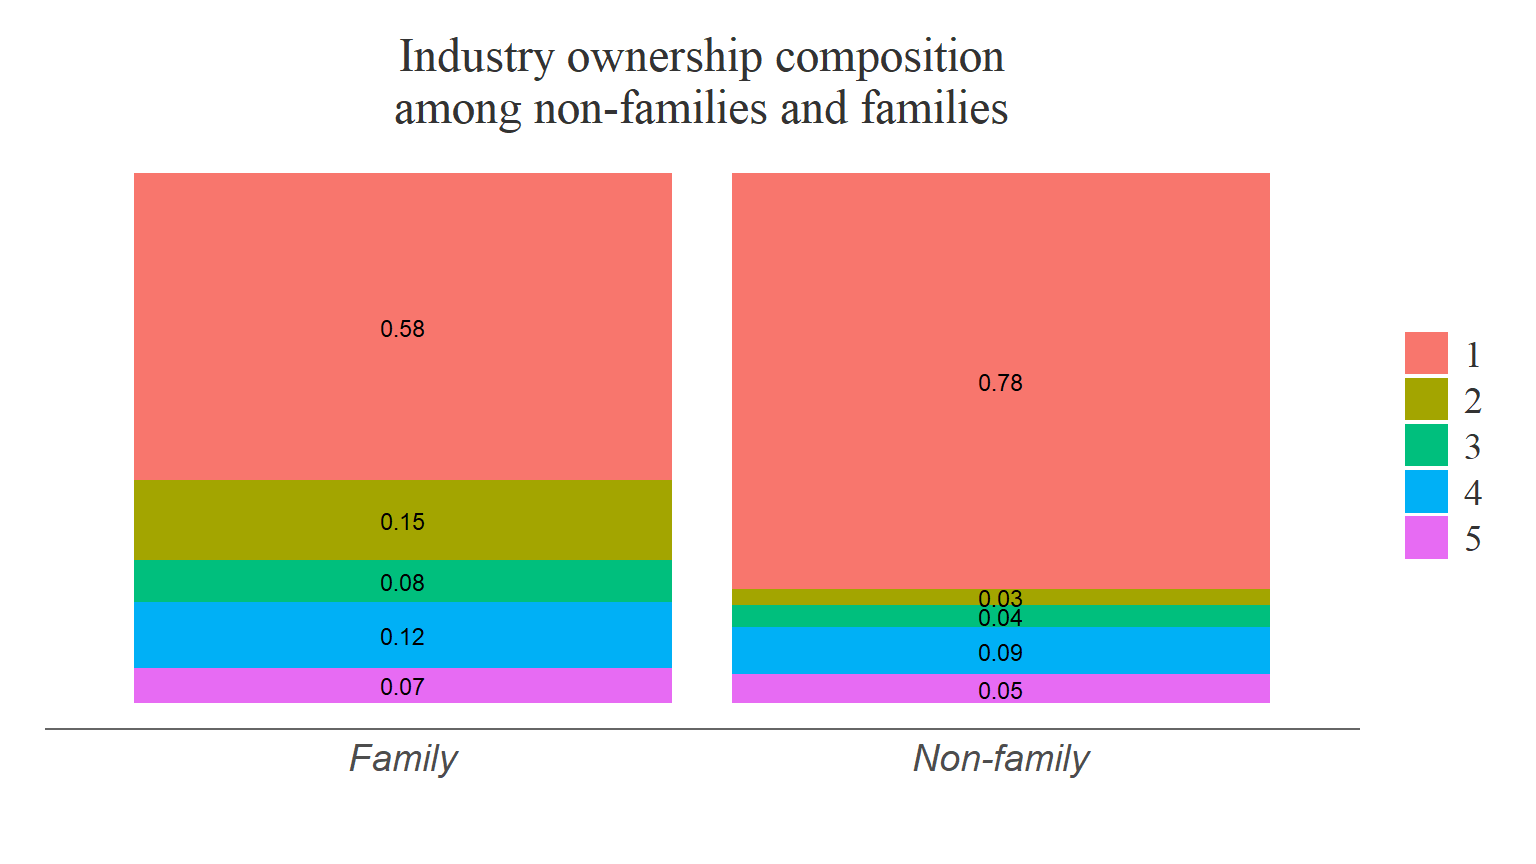
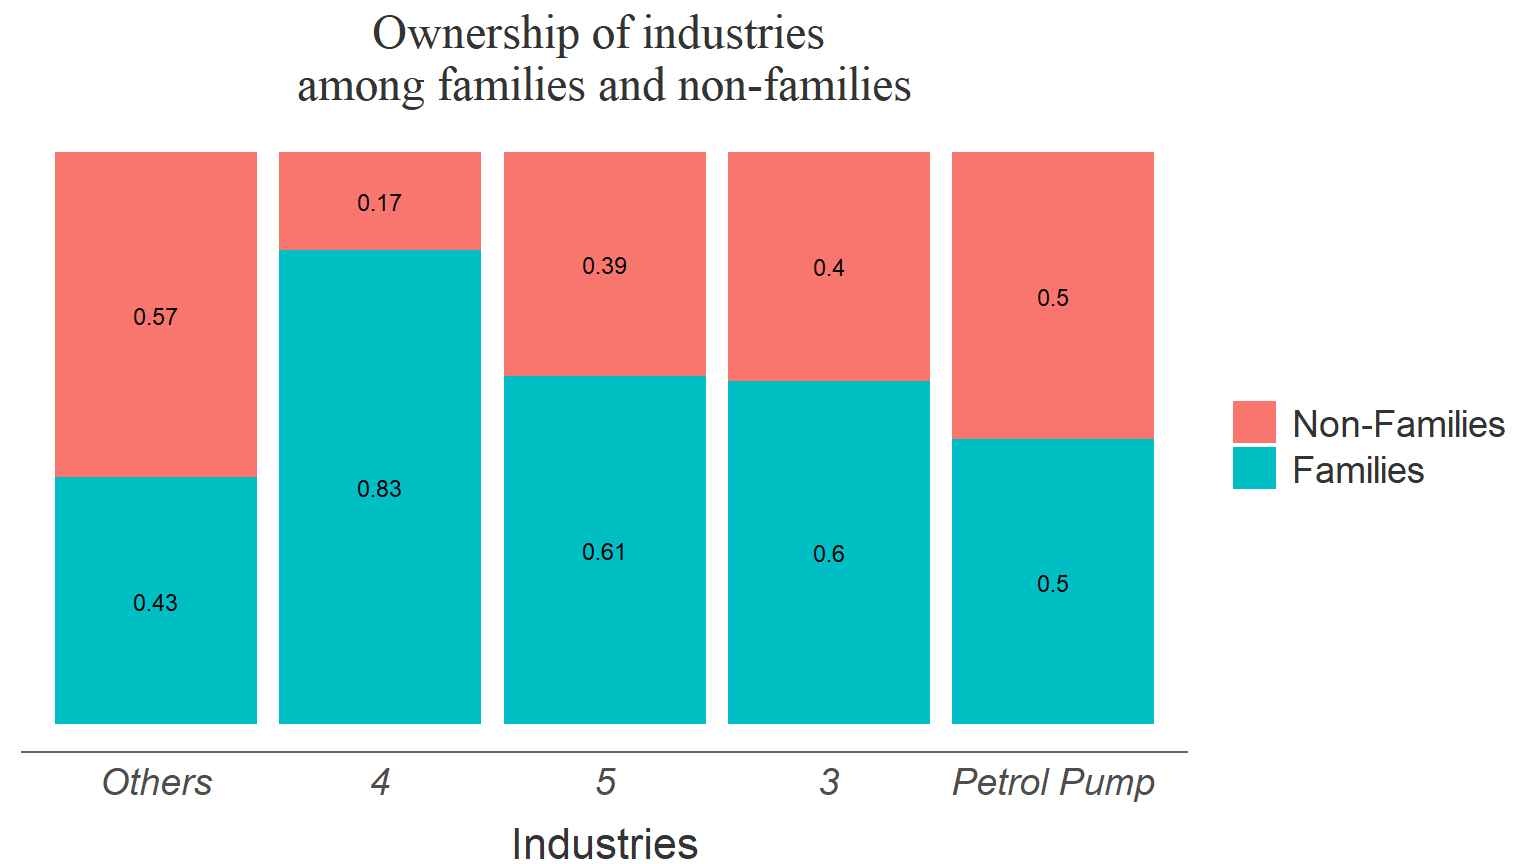
Industries
The dataset records the information regarding the candidate’s family’s ownership of industries in 12 different categories. For the ease if analysis we clubbed them to 5 categories.
| Current category | Old category |
|---|---|
| Petrol Pump | Petrol Pump |
Others
3
4
5
Families
Ownership of industries among families and non-families
| Politician’s identity | Average number of ownersip |
|---|---|
| Family | 1.65 |
| Non-family | 0.67 |
rent thick
Ownership of rent thick and non-rent thick industires with regards to the family type.
| Politician’s identity | rent-type | Proportion |
|---|---|---|
| Family | non-rent-thick | 0.39 |
| Family | rent-thick | 0.61 |
| Non-family | non-rent-thick | 0.71 |
| Non-family | rent-thick | 0.29 |
Ownership of industries among families and non-families with regards to the industry category.
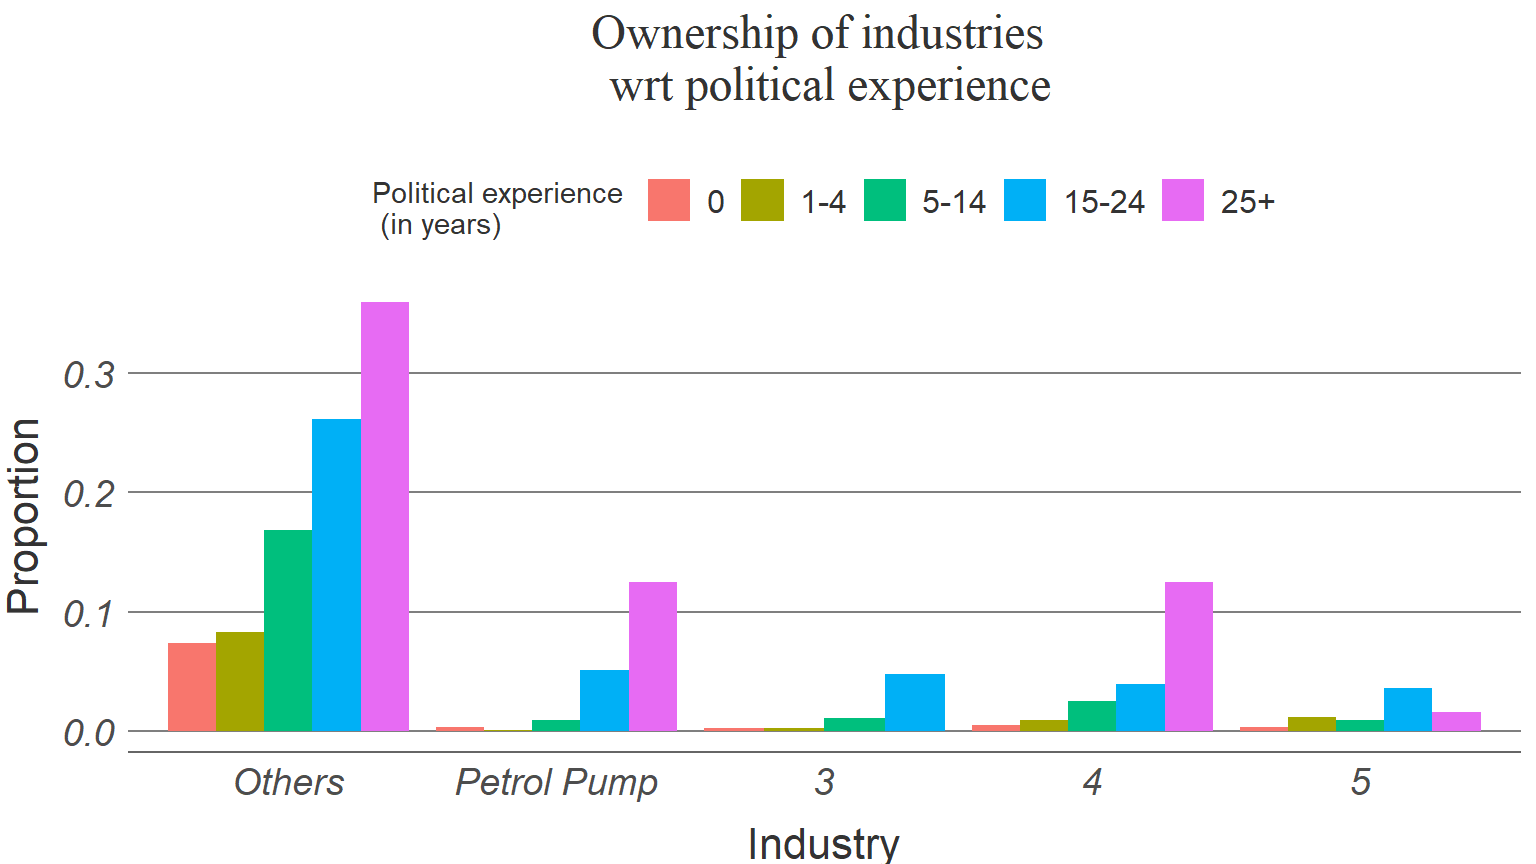
Political experience
Ownership of industries with regards to the candidate’s political experience
Political experience
Family
Political experience composition among families and non-families.
This tables shows the distribution of the unique individuals’ experience/
| Experience Categories | Count |
|---|---|
| 0 | 2164 |
| 1-5 | 1562 |
| 6-15 | 932 |
| 16+ | 244 |
This table shows the distribution of the experience categories among the families and non-families.
| Experience Categories | Non-Families | Families |
|---|---|---|
| 0 | 2148 | 16 |
| 1-5 | 1520 | 42 |
| 6-15 | 811 | 121 |
| 16+ | 123 | 121 |
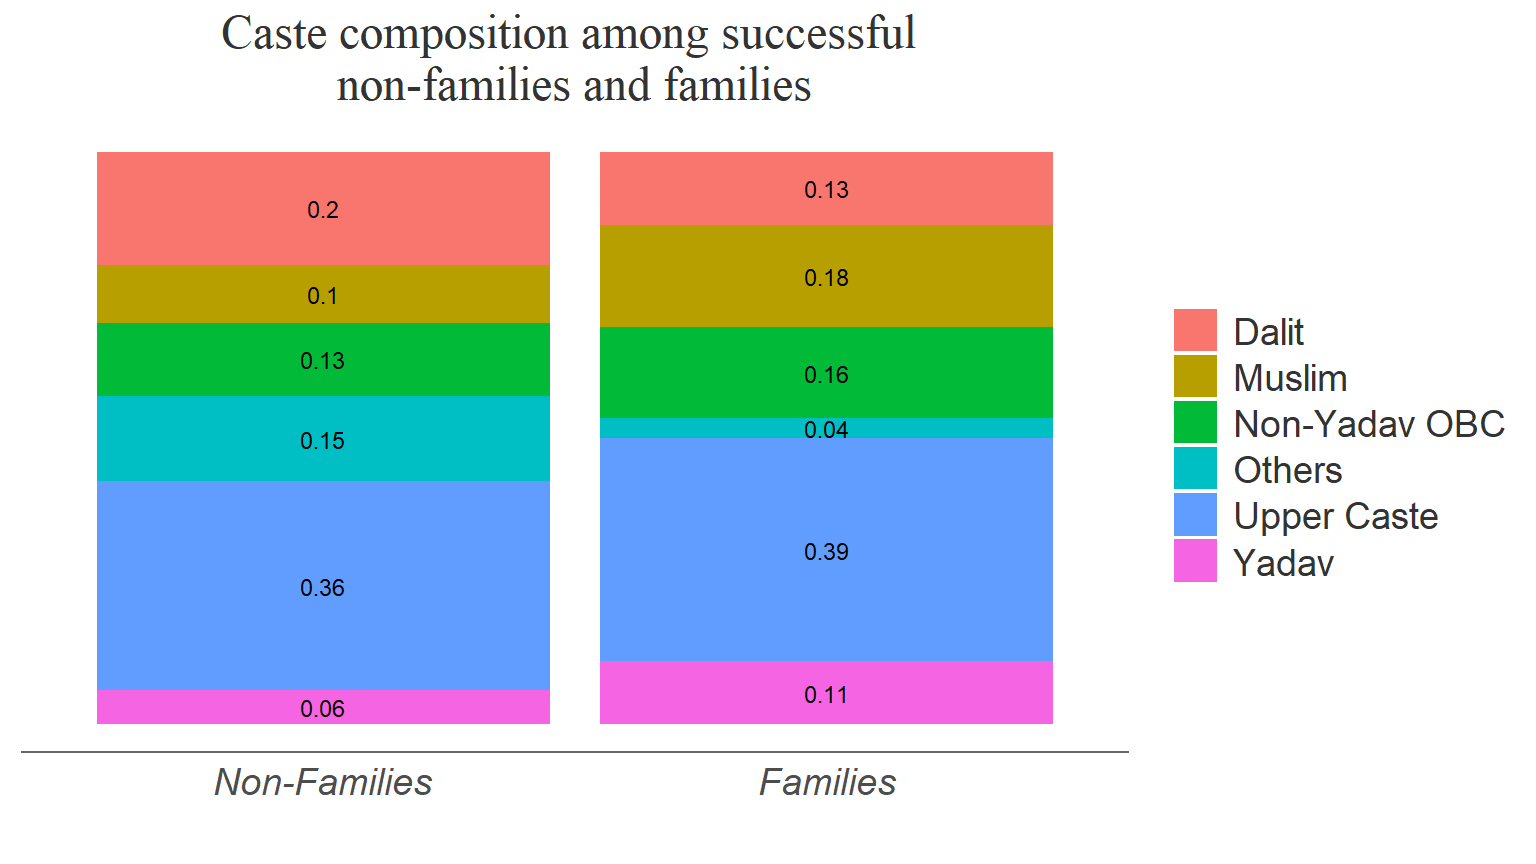
caste
This shows the caste composition of the candidates with regards to their experience.
