MPLADS Analysis
Document History
Original Publish Date: 18 June, 2020
Updated on: 07 September, 2020
## [1] "LS/RS: 15th Lok Sabha" "LS/RS: 14th Lok Sabha"Summary stats
This mplads data is for the 14th and 15the Loksabha which commenced on 20004 and 2009 respectively. We matched it with Uttar Pradesh MPs for the same years.
Observations: 33177, 1
Years : 2009 and 2014 - 25 and 31 dynast MPs respectively.
Main variables : Type of project and the cost incurred. Main categories of type of projects are Road, Electricity, Education, Construction, Water, Others, Sanitation
Family v/s Non-family
This table shows the average number of projects and the cost for the family types. First table is forboth years and the second one is year by year break-up of the same.
| Type of constiuency | Average number of projects | Avergae expenditure per project |
|---|---|---|
| Non-family | 321 | 349773 |
| Family | 432 | 317017 |
| Year | Type of constiuency | Average number of contracts | Avergae expenditure per project |
|---|---|---|---|
| 2004 | Family | 331 | 290796 |
| 2004 | Non-family | 345 | 304660 |
| 2009 | Family | 521 | 340058 |
| 2009 | Non-family | 285 | 420557 |
Days
When we looked at number of days that is required to finish a project was almost same for both the family types, on average they take 75 days to finish a project. When I looked at it by year, in 2004 dynasts took 12 days extra to finish the work compared to non-dynasts. Interestingly, in 2009 it reversed and dynasts took 12 day lesser than non-dynasts to finish the work
Projects
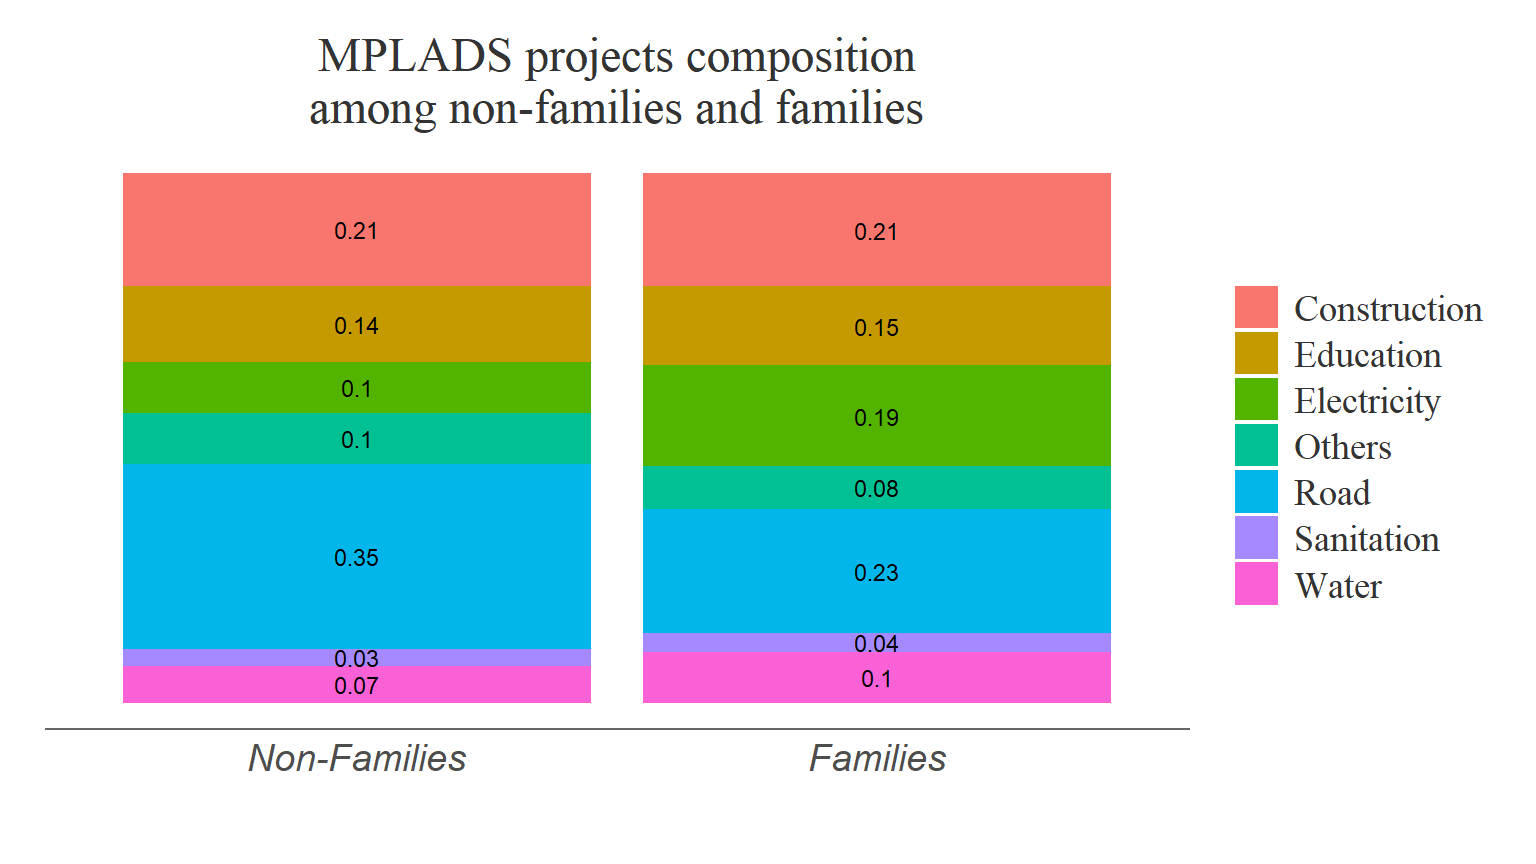
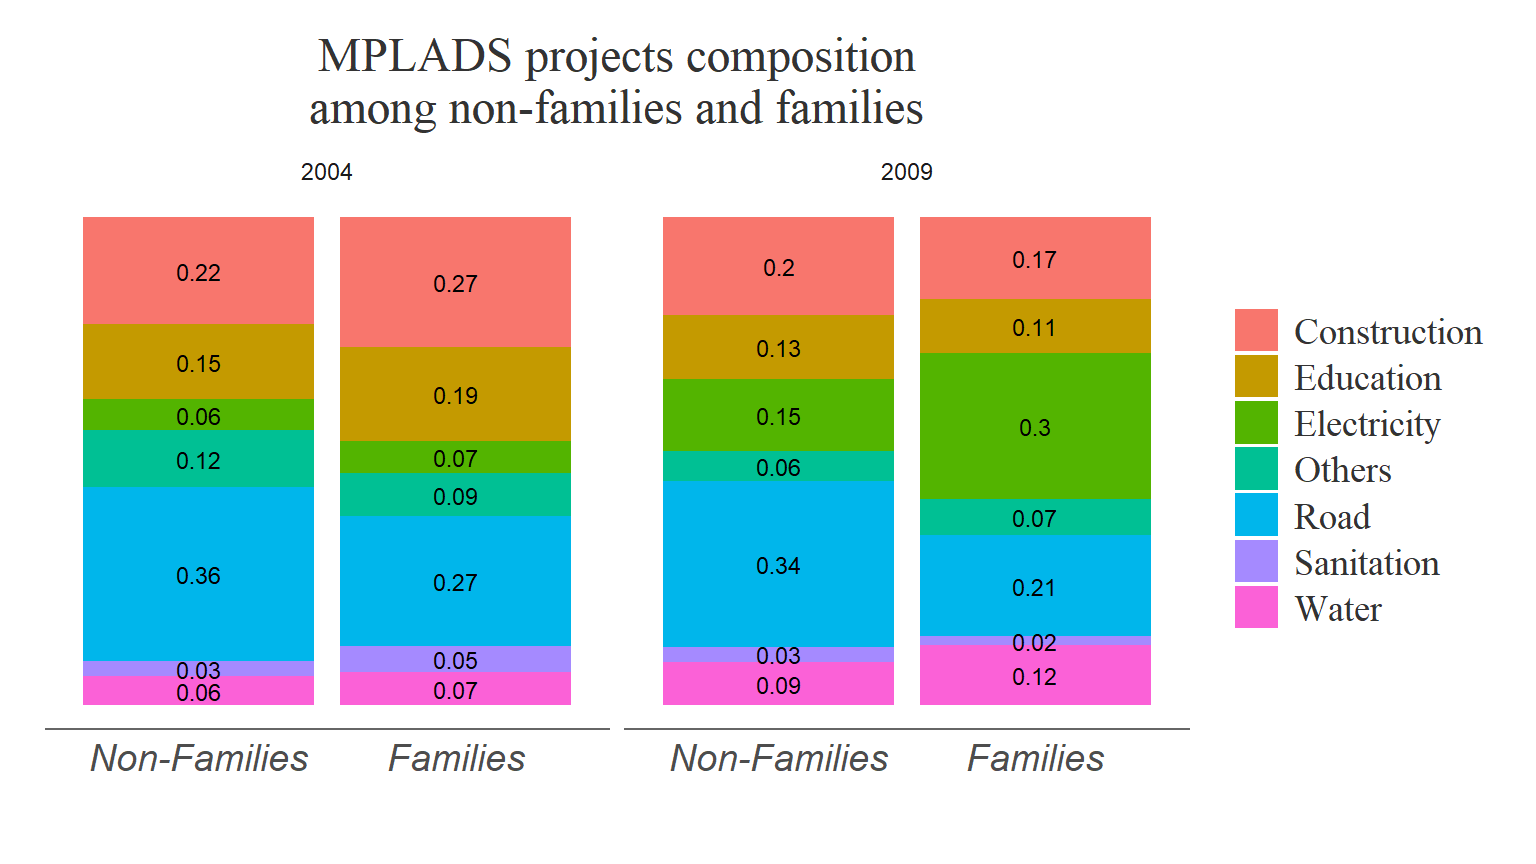
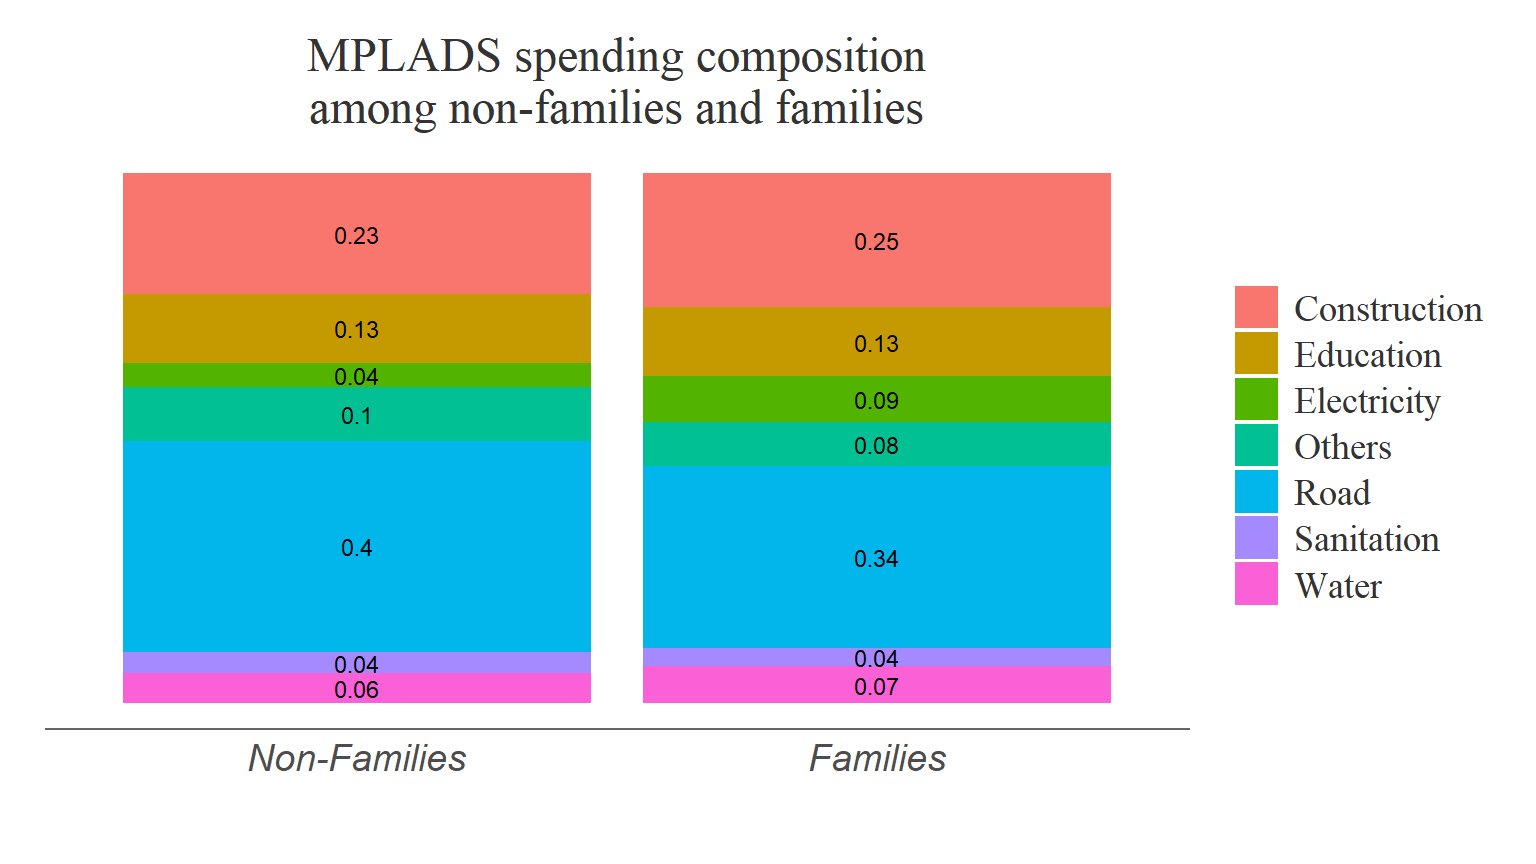
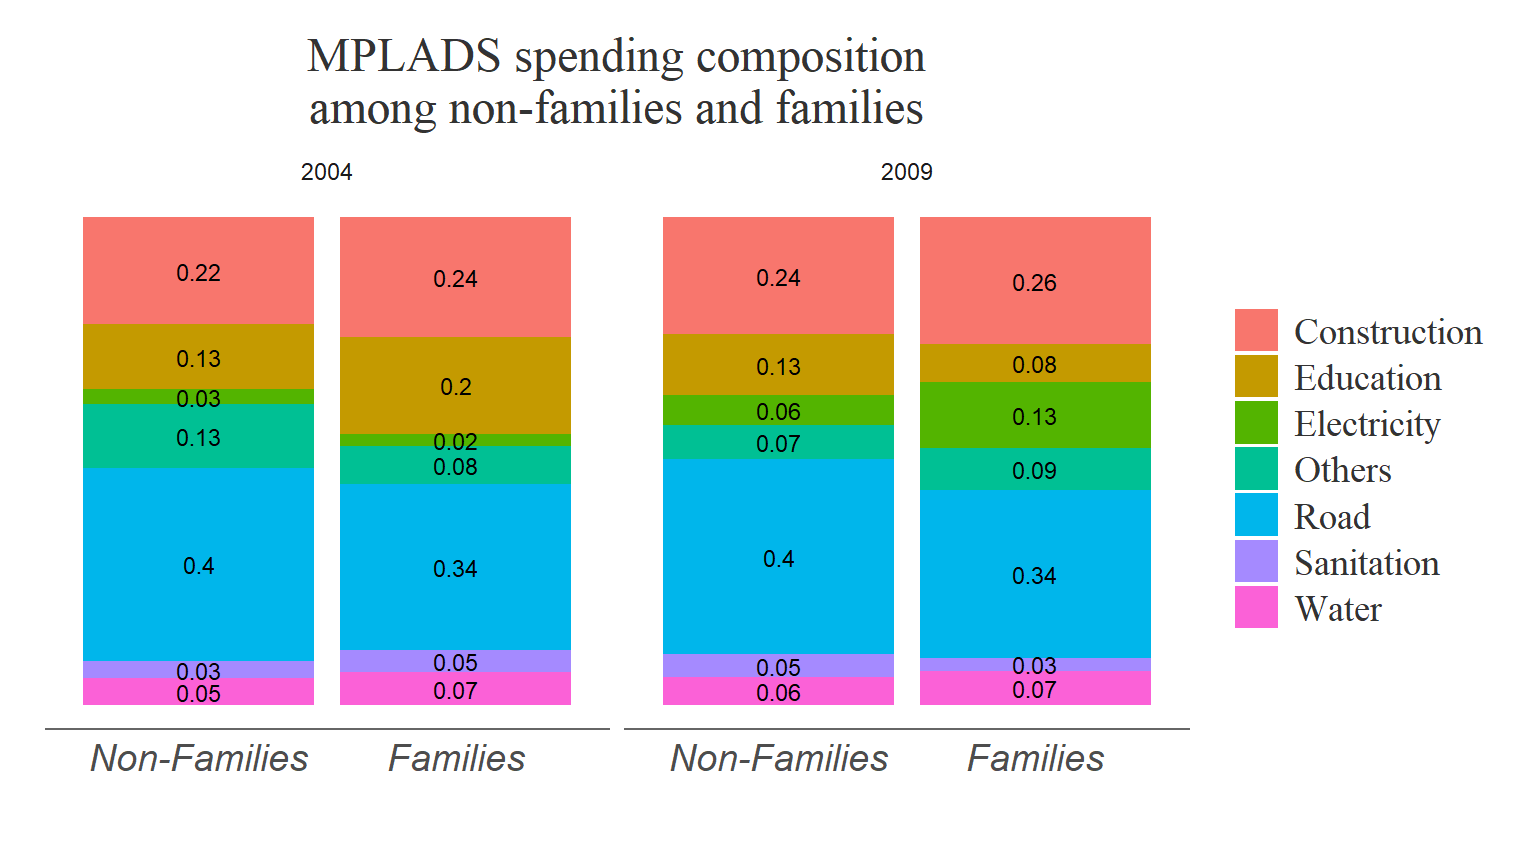
Question - Is there any difference in the project choices of family politicians?
This table shows the composition of the category of the projects they choose work on.
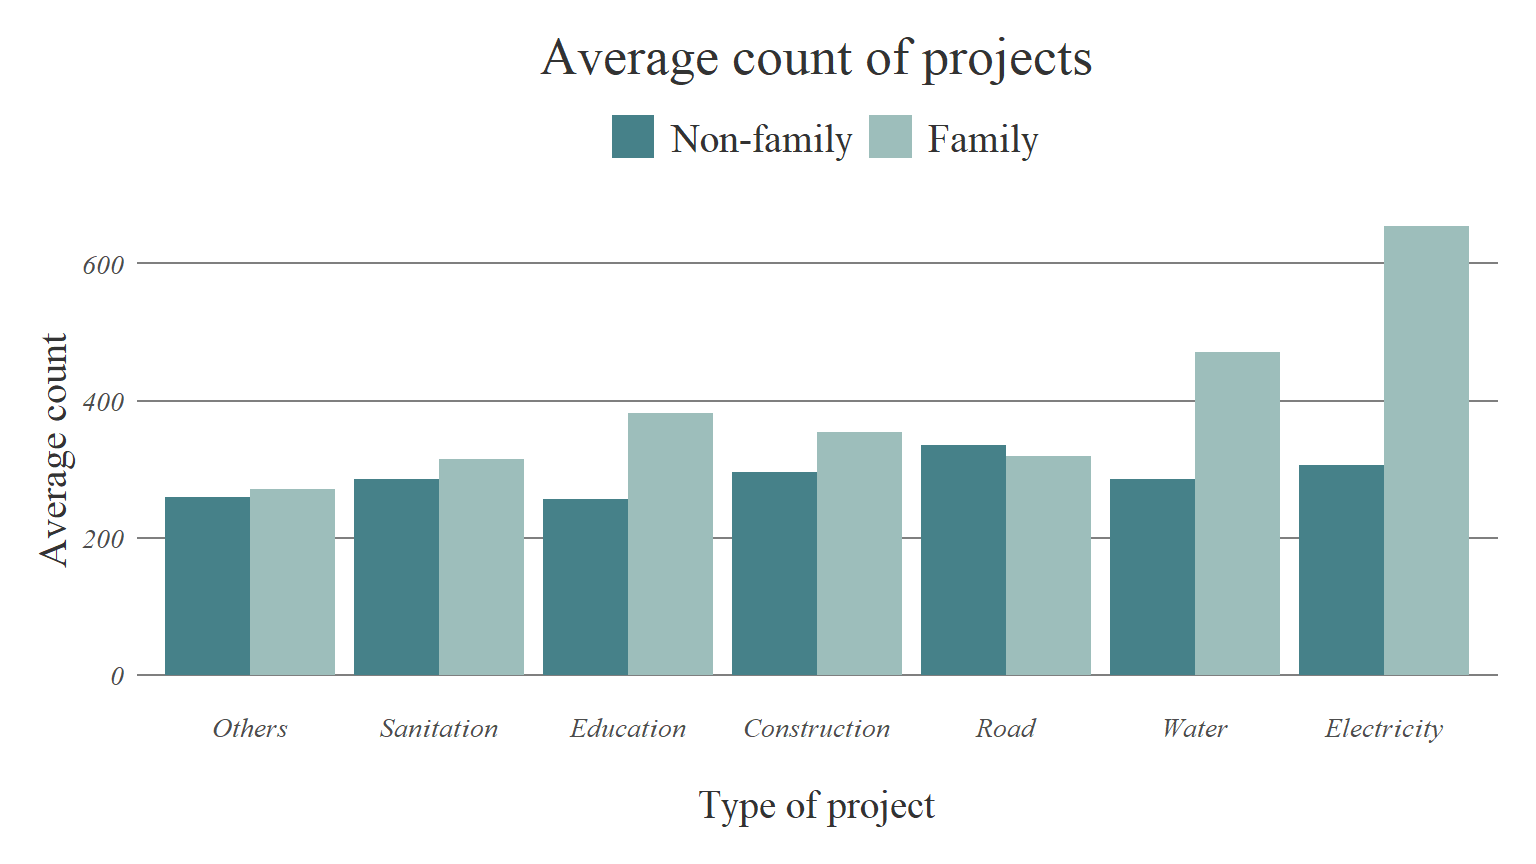
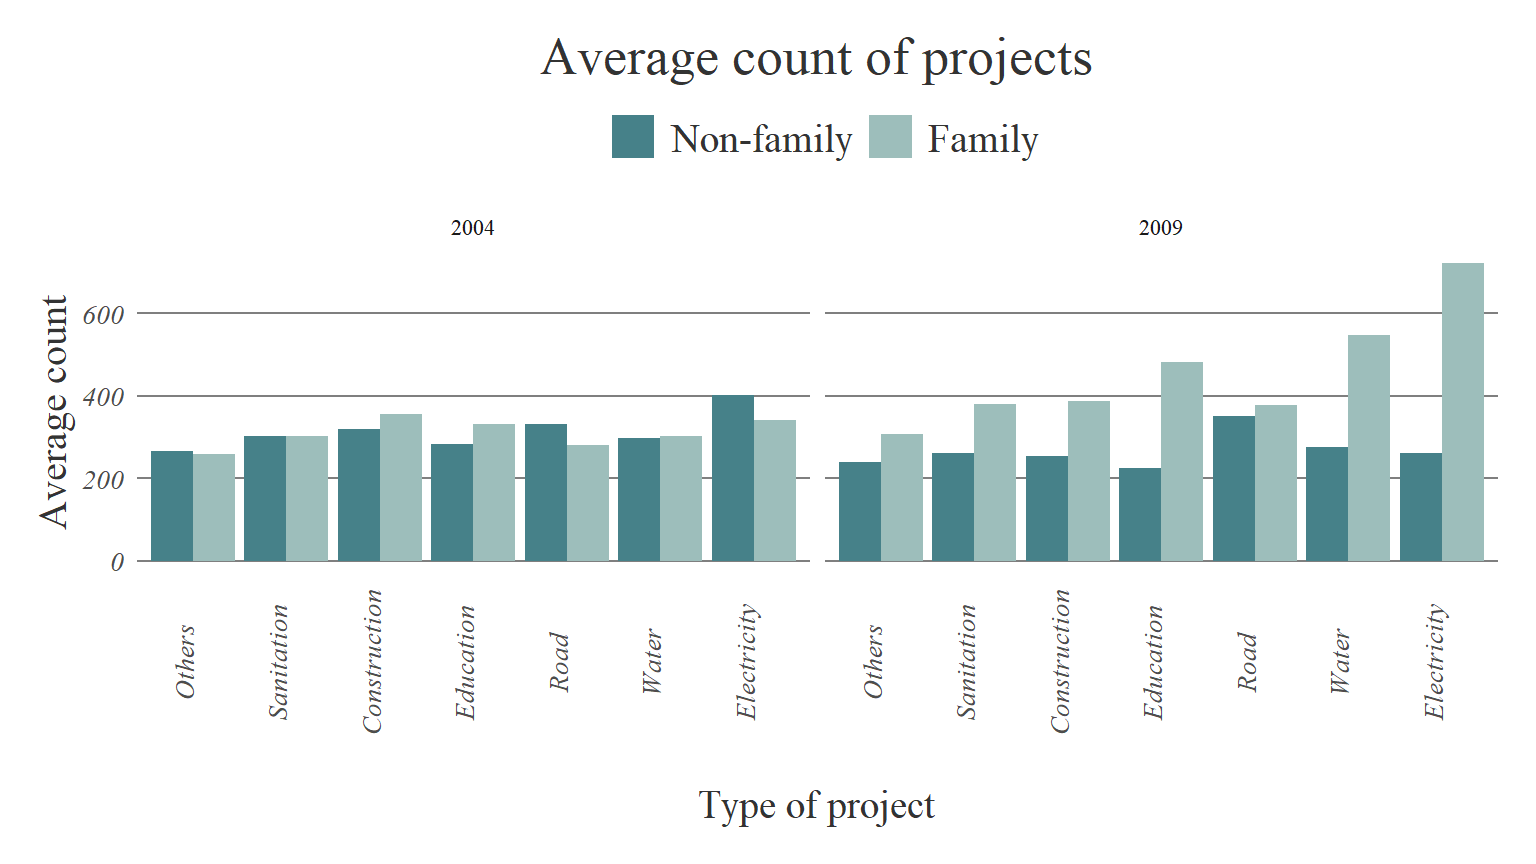
This chart shows the average number of projects of each categories according to the family type.
Expenditure
Question - Is there any difference in the spending patterns of family politicians?
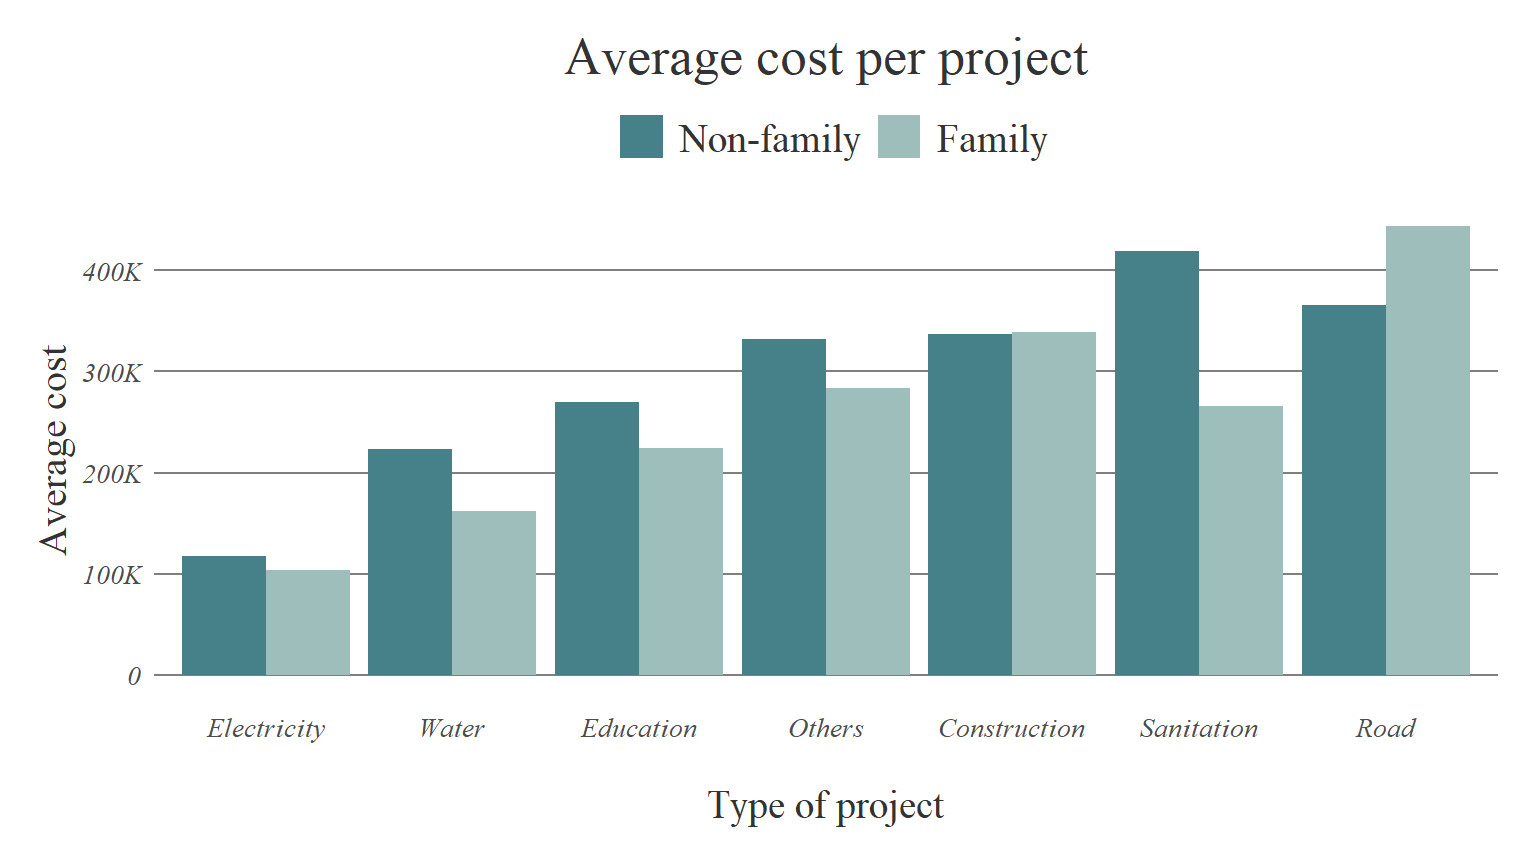
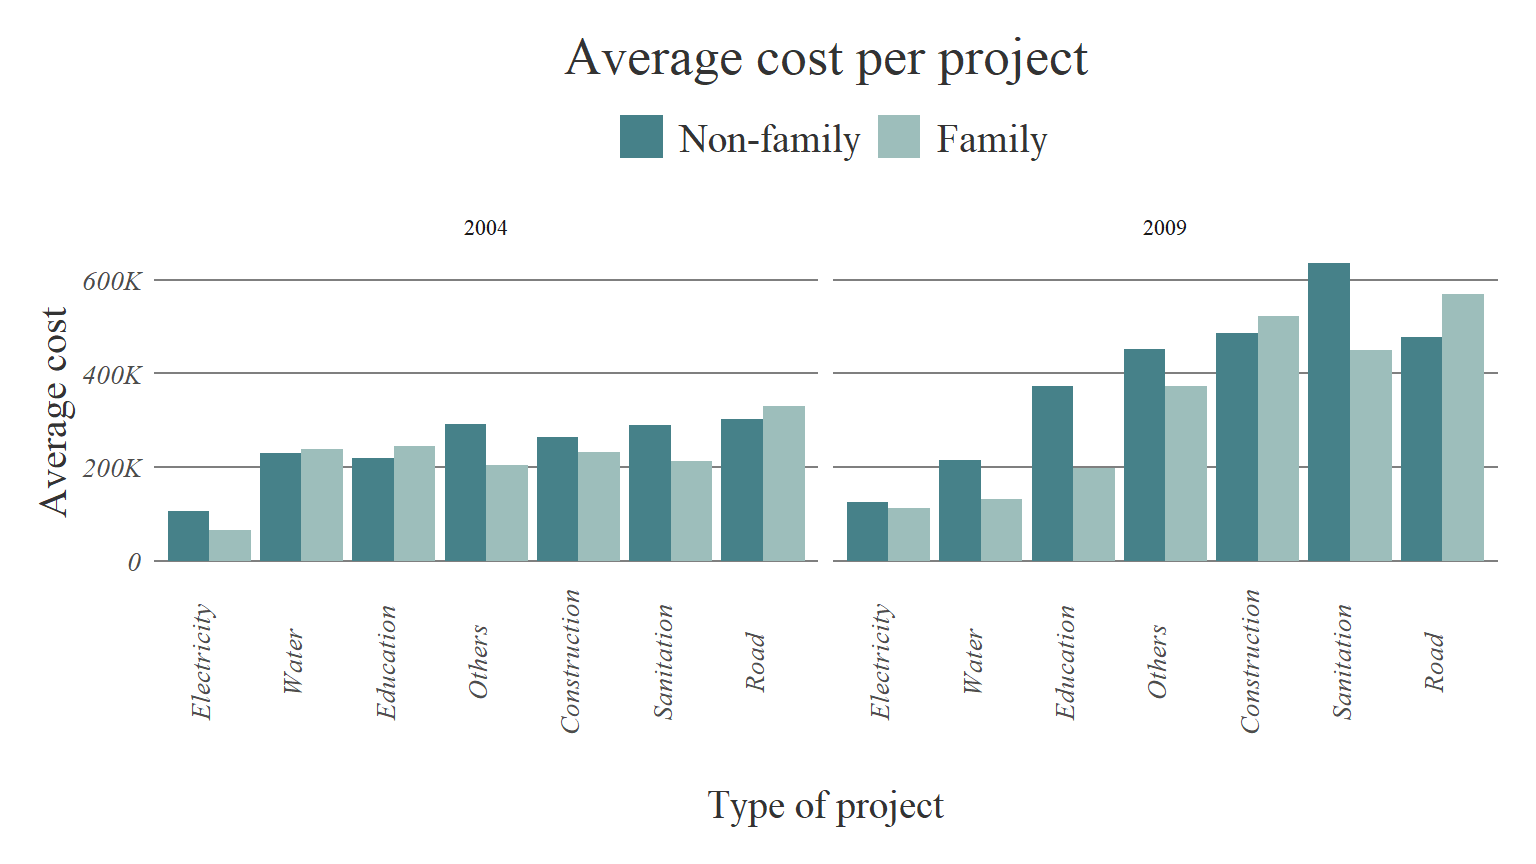
Cost per project
Question : What’s the average cost of a project for each categories?
cost categories
We categorised the projects into three depnding upon the cost of the project:
Categories:
Low - 0-.2 mn
Medium - 2.2 mn - 5 mn
High - 5 mn+
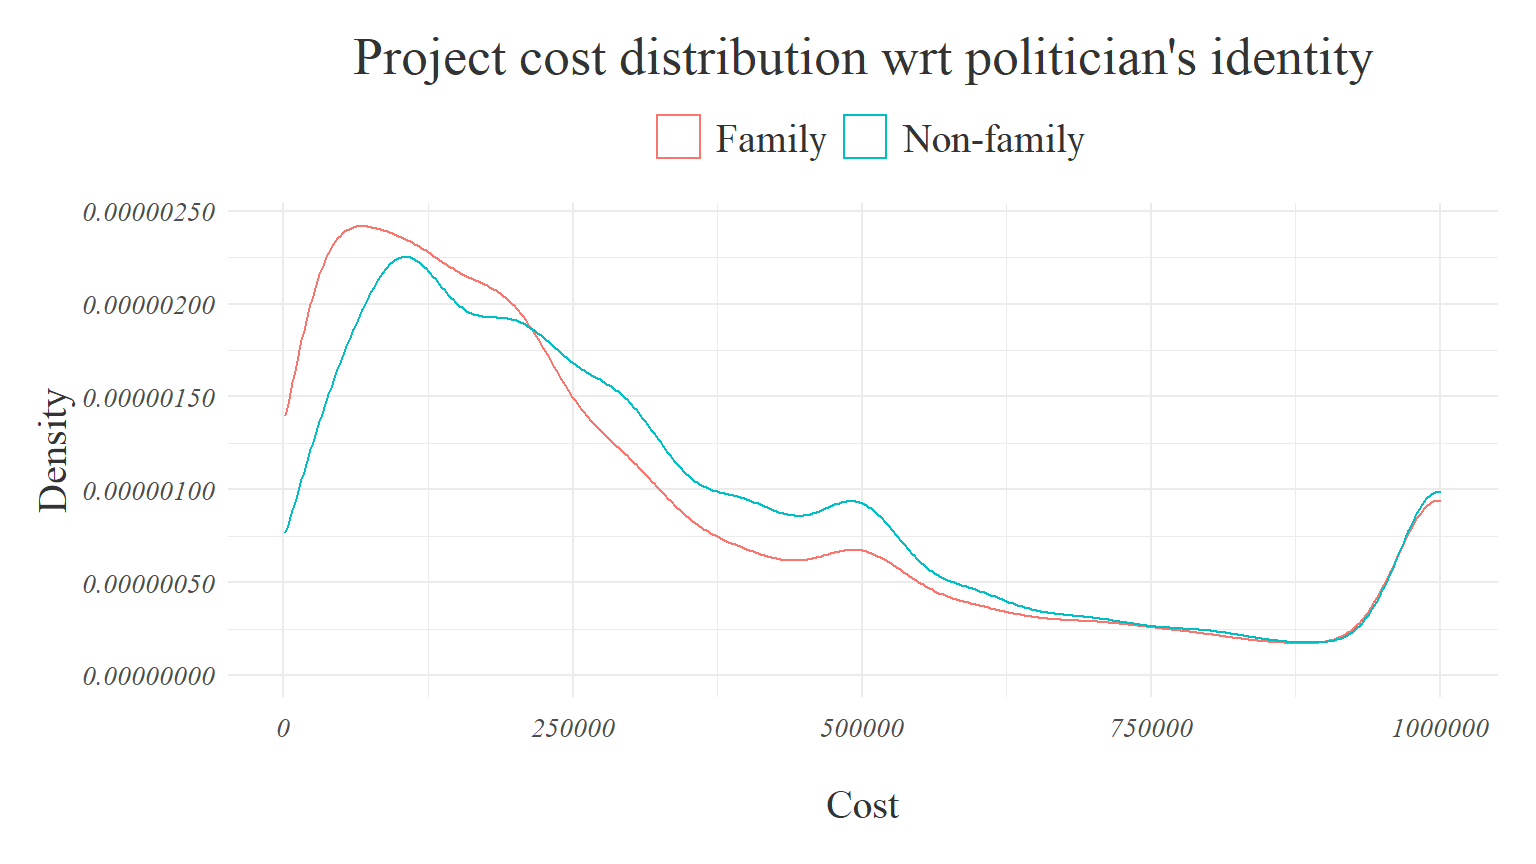
| Cost Categry | Politicians Identity | Proportion of projects |
|---|---|---|
| Low | Family | 0.50 |
| Low | Non-family | 0.40 |
| Medium | Family | 0.29 |
| Medium | Non-family | 0.37 |
| High | Family | 0.21 |
| High | Non-family | 0.23 |