Political Characteristics Analysis
Document History
Original Publish Date: 23 June, 2020
Updated on: 07 September, 2020
In this post we analyse the political characteristics of the family politicians using the TCPD elections data. We use elections data starting from 1974 to 2019. Throughout the entire post we are just using taking the plain mean of all the variables.
Summary
The break-up of the sample data can be sen here
| election_type | Family | Non-family |
|---|---|---|
| AE | 0.09 | 0.91 |
| GE | 0.19 | 0.81 |
Margin of Victory
| election_type | Family | Non-family |
|---|---|---|
| AE | 10.9 | 11.4 |
| GE | 16.2 | 14.8 |
Turnout
| election_type | Family | Non-family |
|---|---|---|
| AE | 55.3 | 51 |
| GE | 53.0 | 52 |
| election_type | fam v/s fam | fam v/s non-fam | non-fam v/s fam | non-fam v/s non-fam |
|---|---|---|---|---|
| AE | 58.1 | 54.8 | 55.9 | 50.6 |
| GE | 54.0 | 52.7 | 54.4 | 51.7 |
Effective number of parties
| election_type | Family | Non-family |
|---|---|---|
| AE | 3.6 | 3.7 |
| GE | 3.2 | 3.3 |
Number of candidates
| election_type | Family | Non-family |
|---|---|---|
| AE | 14.7 | 14.3 |
| GE | 17.8 | 15.4 |
Turncoat
| election_type | Family | Non-family |
|---|---|---|
| AE | 0.17 | 0.24 |
| GE | 0.12 | 0.19 |
Same party
| election_type | Family | Non-family |
|---|---|---|
| AE | 0.61 | 0.47 |
| GE | 0.79 | 0.63 |
Incumbent
| election_type | Family | Non-family |
|---|---|---|
| AE | 0.24 | 0.22 |
| GE | 0.48 | 0.26 |
Recontest
| election_type | Family | Non-family |
|---|---|---|
| AE | 0.45 | 0.44 |
| GE | 0.67 | 0.47 |
Number of terms
| election_type | Family | Non-family |
|---|---|---|
| AE | 1.7 | 1.6 |
| GE | 2.5 | 1.8 |
Constituency type
| election_type | constituency_type | Family | Non-family |
|---|---|---|---|
| AE | GEN | 0.87 | 0.77 |
| AE | SC | 0.13 | 0.23 |
| GE | GEN | 0.90 | 0.77 |
| GE | SC | 0.10 | 0.23 |
Raphael
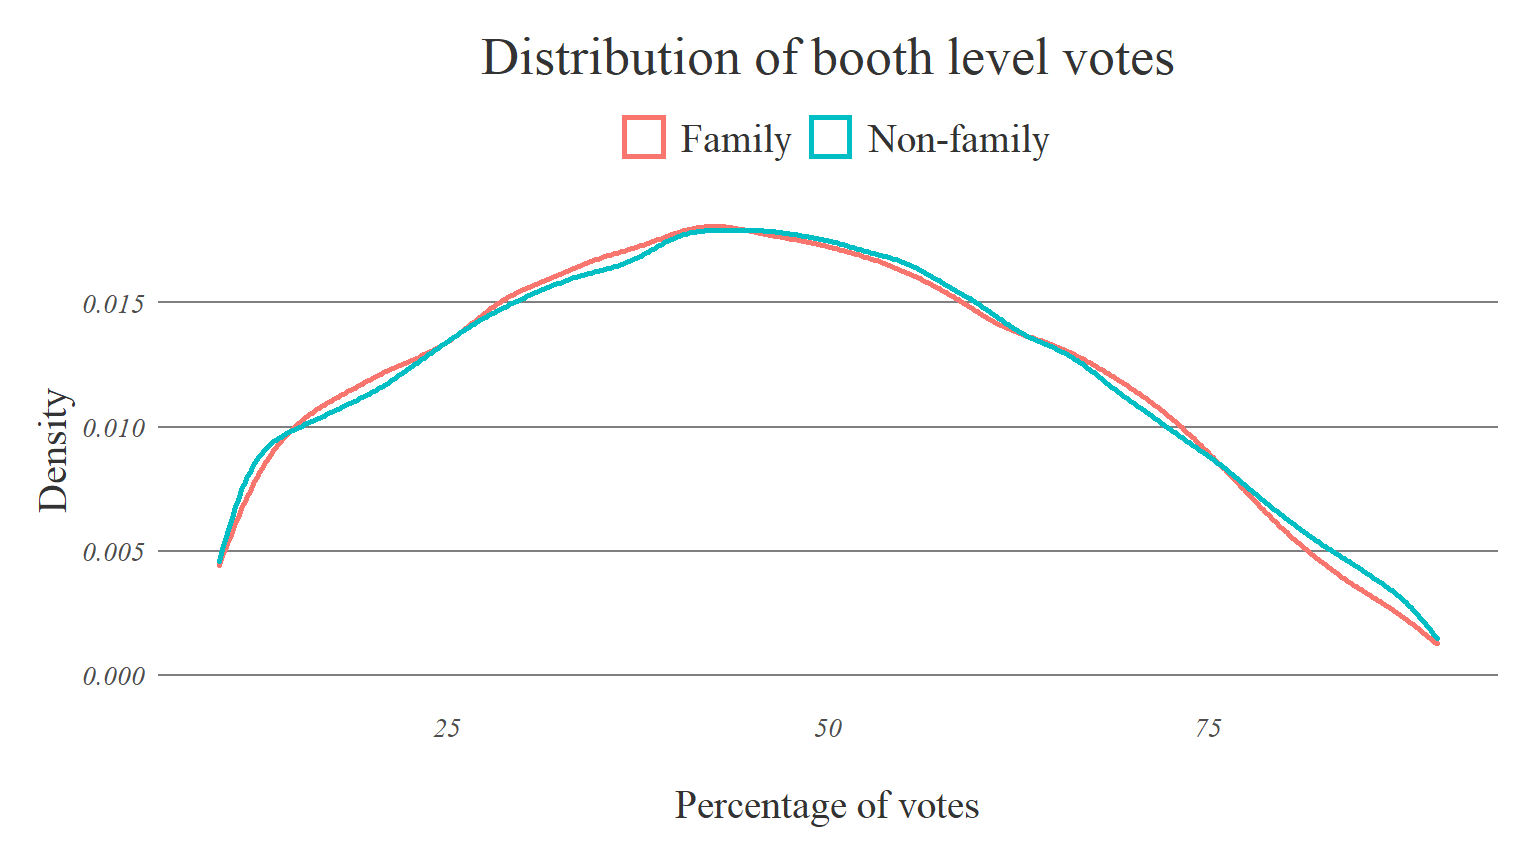
Vote dispersion
Raphael’s booth level data is available for the last 3 UP assembly elections. We use the booth level voting data to see the spread of the vote share.
| Politician’s Identity | Variance |
|---|---|
| Family | 354 |
| Non-family | 341 |
| Politician’s Identity | SD |
|---|---|
| Family | 18.6 |
| Non-family | 18.2 |